Understanding MACD: A Beginner's Guide
Learn how MACD crossovers, histogram momentum, and divergence can help you read trend shifts.

Introduction To Understanding MACD: A Beginner's Guide
MACD is a momentum and trend tool built from moving averages. It tells you whether buying or selling pressure is accelerating - which crossovers and histogram changes reveal before price makes it obvious.
MACD stands for Moving Average Convergence Divergence. It is a momentum and trend-following indicator built from two exponential moving averages (EMAs). Unlike oscillators that move between fixed ranges (like RSI), MACD is unbounded and fluctuates above and below a centerline.
MACD helps traders answer three core questions:
- Is momentum strengthening or weakening?
- Is a trend beginning, continuing, or fading?
- Is there early evidence of a potential reversal?
Because it combines trend-following elements (moving averages) with momentum analysis (rate of change between averages), MACD is one of the most widely used indicators in technical analysis.
It does not predict the future on its own. Instead, it provides structure for evaluating shifts in trend strength.
Core components
MACD consists of three main parts:
- The MACD line
- The signal line
- The histogram
Understanding how each component works is essential.
MACD line
The MACD line is calculated by subtracting the 26-period exponential moving average (EMA) from the 12-period EMA:
MACD = 12 EMA - 26 EMA
Because the 12 EMA reacts faster to price than the 26 EMA, the difference between them measures short-term momentum relative to longer-term trend direction.
- When the short-term EMA is above the long-term EMA, the MACD line is positive.
- When the short-term EMA is below the long-term EMA, the MACD line is negative.
This relationship shows whether short-term momentum is stronger or weaker than the broader trend.
When the MACD line rises, upside momentum is increasing. When it falls, downside pressure is growing.
Signal line
The signal line is typically a 9-period EMA of the MACD line.
It smooths out the MACD line and acts as a trigger for signals. Because it is slower than the MACD line, crossovers between the two are closely watched by traders.
- When MACD crosses above the signal line, momentum is improving.
- When MACD crosses below the signal line, momentum is weakening.
The signal line does not determine trend direction by itself. It helps identify shifts in acceleration.
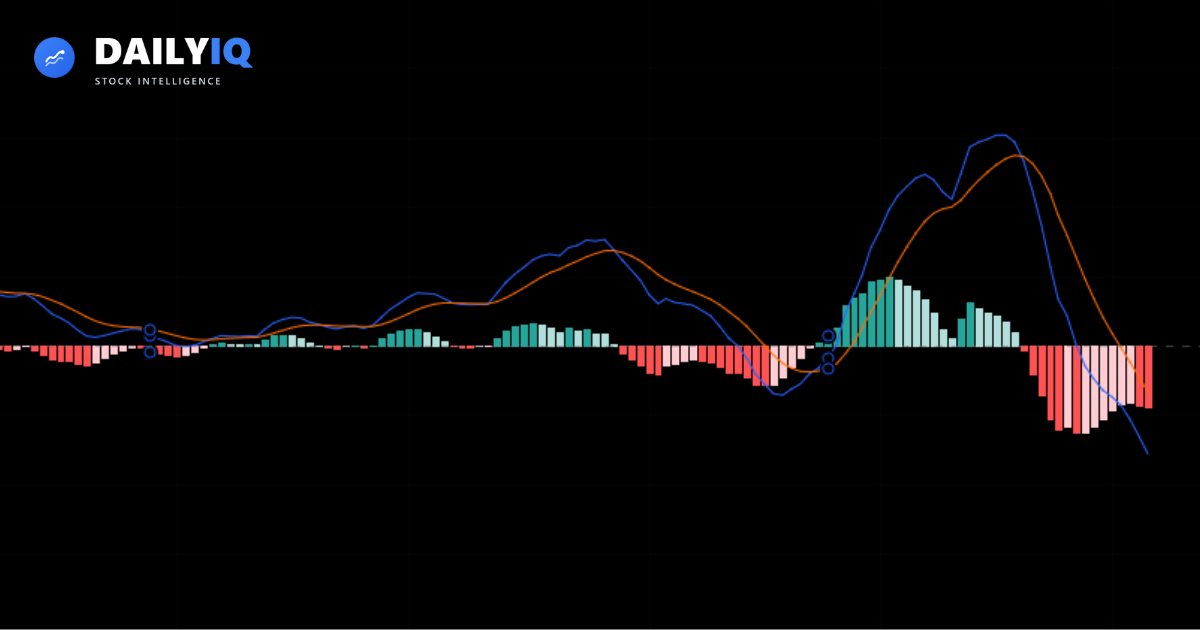
Histogram
The histogram measures the difference between the MACD line and the signal line:
Histogram = MACD - Signal Line
The histogram visually shows how far apart the two lines are.
- Expanding histogram bars suggest accelerating momentum.
- Shrinking histogram bars suggest slowing momentum.
The histogram often turns before the crossover happens. For this reason, experienced traders sometimes use it to anticipate potential signal shifts.
For example:
- If the histogram is rising toward zero, bearish momentum may be fading.
- If it begins falling from positive territory, bullish momentum may be weakening.
The histogram adds clarity to momentum changes that may not be obvious from crossovers alone.
Interpreting MACD
MACD can generate several types of signals. The key is understanding context.
Bullish crossover
A bullish crossover occurs when the MACD line crosses above the signal line.
This suggests that short-term momentum is strengthening relative to the longer-term trend.
In strong uptrends, bullish crossovers often appear after pullbacks and can signal continuation.
However, in sideways markets, crossovers may generate false signals. This is because EMAs constantly adjust in response to minor price changes.
Bullish crossovers are strongest when:
- Price is above key moving averages.
- Volume confirms buying pressure.
- The broader market supports risk-on conditions.
Bearish crossover
A bearish crossover occurs when the MACD line crosses below the signal line.
This suggests weakening momentum and potential downside pressure.
In downtrends, bearish crossovers may confirm continuation after rallies.
Like bullish signals, bearish crossovers are more reliable in trending markets. In choppy conditions, they may result in whipsaws.
Traders often combine bearish crossovers with:
- Breakdown below support.
- Increasing selling volume.
- Weak broader market structure.
Centerline crossover
Another important signal is the centerline crossover.
The centerline represents zero. When MACD crosses above zero, the short-term EMA has moved above the long-term EMA. This signals potential bullish trend development.
When MACD crosses below zero, it suggests bearish trend development.
Centerline crossovers are slower but often more reliable because they reflect broader trend shifts rather than short-term fluctuations.
Divergence
Divergence is one of the most powerful MACD concepts.
It occurs when price and MACD move in opposite directions.
Bullish divergence:
- Price makes a lower low.
- MACD makes a higher low.
This suggests that downside momentum is weakening even though price is still falling.
Bearish divergence:
- Price makes a higher high.
- MACD makes a lower high.
This suggests that upside momentum is fading despite price pushing higher.
Divergence does not guarantee reversal. In strong trends, it may appear multiple times before price changes direction. However, it often provides early warning of momentum shifts.
MACD in trending vs sideways markets
MACD performs best in trending environments.
Because it is built from moving averages, it reacts to sustained directional movement. In strong trends, MACD helps confirm continuation and identify pullback entries.
In sideways markets, however, MACD crossovers can generate frequent false signals. This happens because small price movements cause the EMAs to cross repeatedly without meaningful trend change.
For this reason:
- In trends → focus on crossovers and histogram expansion.
- In ranges → rely more on support, resistance, and oscillators like RSI.
Understanding market structure improves MACD interpretation significantly.
MACD vs RSI
MACD and RSI both measure momentum but in different ways.
- RSI measures speed of gains vs losses within a fixed 0–100 range.
- MACD measures the relationship between two moving averages.
RSI is often better at identifying overbought or oversold conditions.
MACD is often better at identifying trend acceleration and crossover-based momentum shifts.
Many traders use both together for confirmation.
How DailyIQ uses MACD
DailyIQ uses MACD as a momentum layer inside a multi-factor Technical Score. Rather than acting on individual crossovers, the system looks at the overall momentum picture: is MACD direction aligned with the broader trend? Is the histogram expanding or contracting? Does the signal confirm or contradict what RSI and price structure are showing?
Histogram direction often matters more than the raw crossover. When bars are shrinking toward zero, momentum is weakening even if price has not yet turned. That early shift in histogram direction - before the actual line crossover - is one of the more useful readings MACD provides.
Divergence is tracked as a supplementary signal rather than a standalone trade trigger. The combination of MACD divergence, weakening structure, and declining volume all pointing in the same direction is far more meaningful than any one of them in isolation.
Practical takeaways
MACD is most reliable when the market is actually trending. In sideways conditions, EMAs adjust repeatedly to small price oscillations and generate crossovers with no real momentum behind them. Recognizing range-bound conditions and lowering MACD signal weight is itself part of using the indicator correctly.
The histogram is underused. Most new traders focus on crossovers, but the histogram tells you momentum before the cross happens. Bars that are shrinking while still positive suggest the bullish trend is losing steam. That early read is often more valuable than waiting for the line cross itself.
Patience with MACD matters. It is a slower, smoother indicator by design. Forcing it to generate signals in choppy markets by lowering thresholds usually produces more noise, not more accuracy. Let structure and market regime define when MACD readings are meaningful.
Reading the histogram in depth
Most traders focus on the MACD line and signal line crossovers, but the histogram is often the more valuable component because it turns before the crossover happens. Understanding histogram behavior in depth can give you a meaningful timing advantage.
Expanding histogram bars
When the histogram bars are growing in size — regardless of whether they are positive or negative — momentum is accelerating. Expanding positive bars mean buying pressure is strengthening. Expanding negative bars mean selling pressure is intensifying. This acceleration is often the most reliable confirmation that a trend is gaining power.
Shrinking histogram bars
Shrinking histogram bars signal deceleration, even when the trend is still in place. Positive bars that are getting smaller tell you that buying momentum is fading, even if price is still technically making new highs. This is the earliest MACD warning sign that a trend may be running out of power.
The histogram zero crossing
When histogram bars shift from positive to negative (or vice versa), the MACD and signal lines have crossed. But because the histogram shift often precedes the visible crossover on a chart, traders who watch histogram direction can often anticipate the cross and position accordingly.
Practical histogram reading
The best histogram-based setups occur when:
- Histogram shifts from negative to positive after a pullback in an uptrend
- Histogram bars are small and tightening after a prior expansion, suggesting the next expansion may be in the trend direction
- Histogram makes a higher low while price makes a lower low (bullish divergence visible in histogram before price confirms)
Zero-line crossovers
The zero line in MACD represents the point where the fast EMA (12-period) equals the slow EMA (26-period). Crossings of this level represent a shift in whether short-term momentum is running above or below longer-term momentum — a more structural signal than signal-line crossovers.
Bullish zero-line crossover
When the MACD line crosses above zero, the 12-period EMA has moved above the 26-period EMA. This is a meaningful development because it means the stock's short-term trend has officially caught up to and exceeded its longer-term trend. For a stock recovering from a downtrend, this zero-line crossover is often the moment institutional money begins to take the recovery seriously.
Bearish zero-line crossover
When the MACD line crosses below zero, the 12-period EMA has dropped below the 26-period EMA. This typically signals that the intermediate trend has turned negative and that rallies are more likely to be sold than sustained.
Zero-line rejection
Perhaps more interesting than crossing the zero line is failing to cross it. When a bullish MACD move approaches zero from below but turns back down before crossing, it signals that buying pressure was insufficient to regain the longer-term trend. This zero-line rejection is a continuation signal for the downtrend and can be a meaningful short-side confirmation.
Similarly, MACD that rallies into positive territory and then fails to sustain above zero — dropping back below — is a bearish zero-line rejection that suggests the rally was temporary and the downtrend remains intact.
MACD settings explained: 12, 26, and 9
The default MACD settings — 12, 26, and 9 — were developed by Gerald Appel for daily equity charts in the 1970s and have become universal defaults. Understanding what these numbers mean helps you make informed decisions about whether to adjust them.
What 12 and 26 represent
The MACD line = 12-period EMA minus 26-period EMA. On a daily chart, this means the difference between approximately 2.5 weeks of price history (12 days) and approximately 5 weeks (26 days). The 12-period EMA captures short-term momentum; the 26-period EMA captures intermediate momentum. Their difference reveals whether recent momentum is running faster or slower than the intermediate trend.
The 9-period signal line is a smoothed average of the MACD line. It acts as a trigger: when the MACD line crosses above its own 9-period average, momentum is improving; when it crosses below, momentum is fading.
Alternative settings
Some traders use faster settings for more active markets:
- 8/17/9: More responsive, better for shorter-term setups and volatile stocks
- 5/35/5: Used for longer timeframes, particularly monthly or weekly charts
- 3/10/16: Very fast, used by some intraday traders
The key principle: shorter periods create more signals with more noise; longer periods create fewer signals with less noise but more lag. Match the settings to the timeframe and the typical volatility of the instrument you are trading.
When to change settings
Default settings work well for most daily chart analysis. The most common reason to adjust is when the instrument is unusually fast-moving (use faster settings) or unusually slow (use slower settings). If you change settings, keep them consistent — comparing MACD values across different setting configurations is not meaningful.
MACD across timeframes
Like RSI and other momentum indicators, MACD becomes more powerful when applied across multiple timeframes simultaneously. The principle is the same: longer timeframes establish the regime; shorter timeframes provide entry timing.
Weekly MACD as trend bias
Weekly MACD provides a longer-term momentum view that filters out much of the daily noise. When the weekly MACD line is above zero and the histogram is positive and expanding, the stock is in a broadly bullish momentum environment. This tells you to prioritize long setups on the daily chart and to be skeptical of short setups, no matter how compelling they look on a shorter timeframe.
When the weekly MACD is negative and declining, even technically attractive daily chart setups carry elevated risk because they are likely to fail as the longer-term momentum headwind reasserts itself.
Daily MACD for setup identification
Daily MACD crossovers and histogram direction provide the actionable entry signals within the bias established by the weekly chart. The highest-conviction daily MACD entries are:
- Signal-line bullish crossover when weekly MACD is positive
- Zero-line crossover from below when weekly MACD is improving
- Bullish divergence on daily MACD confirmed by weekly MACD turning positive
Why MACD lags on lower timeframes
On 5-minute or 15-minute charts, the 12/26/9 settings create a MACD that reacts to price changes so slowly that by the time a crossover forms, the price move that would have been profitable has often already occurred. Either use faster settings on intraday charts or rely on RSI for momentum analysis at shorter timeframes, where it tends to be more responsive and reliable.
MACD and RSI as complementary tools
MACD and RSI are the two most widely used momentum indicators, and while they measure related concepts, their underlying mechanics are different enough that they can complement each other meaningfully.
What each measures differently
RSI measures the ratio of average gains to average losses over a lookback period — it is a normalized, bounded measure (0-100) that tells you how strong recent buying pressure has been relative to selling pressure. MACD measures the difference between two moving averages — it is unbounded and tells you whether short-term momentum is running above or below intermediate momentum.
RSI is better at identifying overbought and oversold conditions in ranging markets. MACD is better at identifying trend acceleration, crossover-based momentum shifts, and divergence in trending markets.
When they agree
When MACD and RSI generate signals in the same direction simultaneously, confidence increases substantially. For example: RSI recovering from below 30 while MACD is making a bullish histogram turn from deeply negative territory creates a more compelling oversold reversal setup than either signal alone.
Similarly, bearish MACD divergence (price higher high, MACD lower high) confirmed by bearish RSI divergence (price higher high, RSI lower high) is a significantly more reliable warning than either divergence in isolation.
When they disagree
When RSI and MACD diverge — one bullish, one bearish — it is generally better to wait for alignment before entering. A stock where RSI is recovering but MACD is still declining is in a mixed momentum environment. Mixed environments often resolve with a failed initial signal before a cleaner directional move, and they are better avoided than traded aggressively.
Watch the Histogram First
The histogram shows you momentum change before the crossover happens. When bars shrink toward zero, acceleration is fading. When they expand away from zero, momentum is building. Reading histogram direction early gives you a head start on the signal.
MACD Works Best in Trends
In ranging markets, EMA lines cross repeatedly without any real directional conviction - producing noisy crossovers that lead nowhere. MACD signals become significantly more reliable when a clear trend already exists and price is not just chopping.
Use Centerline Crosses for Trend Confirmation
When MACD crosses above zero, the short-term EMA has moved above the long-term EMA - a broader shift in momentum that is slower but often more durable than signal-line crosses. Combine centerline direction with price structure for stronger confirmation.
Quick FAQ
What MACD signal is most reliable?
Signals aligned with the broader trend are generally stronger than countertrend crossovers. Context matters more than any single cross.
How should I read the MACD histogram?
Expanding bars suggest momentum acceleration; shrinking bars suggest deceleration. Use this to judge trend strength before crossover signals appear.
Is MACD divergence a guaranteed reversal?
No. Divergence is a warning, not a trigger. Confirm with structure breaks and follow-through before acting aggressively.
Why does MACD fail in sideways markets?
Because repeated minor EMA shifts create frequent crossovers without durable direction. In ranges, support/resistance often has more value.
Should I use MACD alone or with other indicators?
Use it with trend and volatility context. MACD is stronger when it confirms structure rather than trying to replace it.
DailyIQ publishes market education, score methodology, and research workflows to help users understand what the platform is measuring. Content is for informational purposes only and is not investment advice or a recommendation to buy or sell any security.
Use education with process, not in isolation
See how DailyIQ combines technical indicators, news sentiment, freshness checks, and editorial review to decide what gets surfaced and indexed.
Learn About Investing
These resources can help investors evaluate momentum, volatility, and trend strength when analyzing Understanding MACD: A Beginner's Guide.
