DailyIQ Learning Center
Master technical analysis, understand market indicators, and learn how to use DailyIQ to improve your trading decisions.
Featured
Check out our featured article and strengthen your understanding of market structure
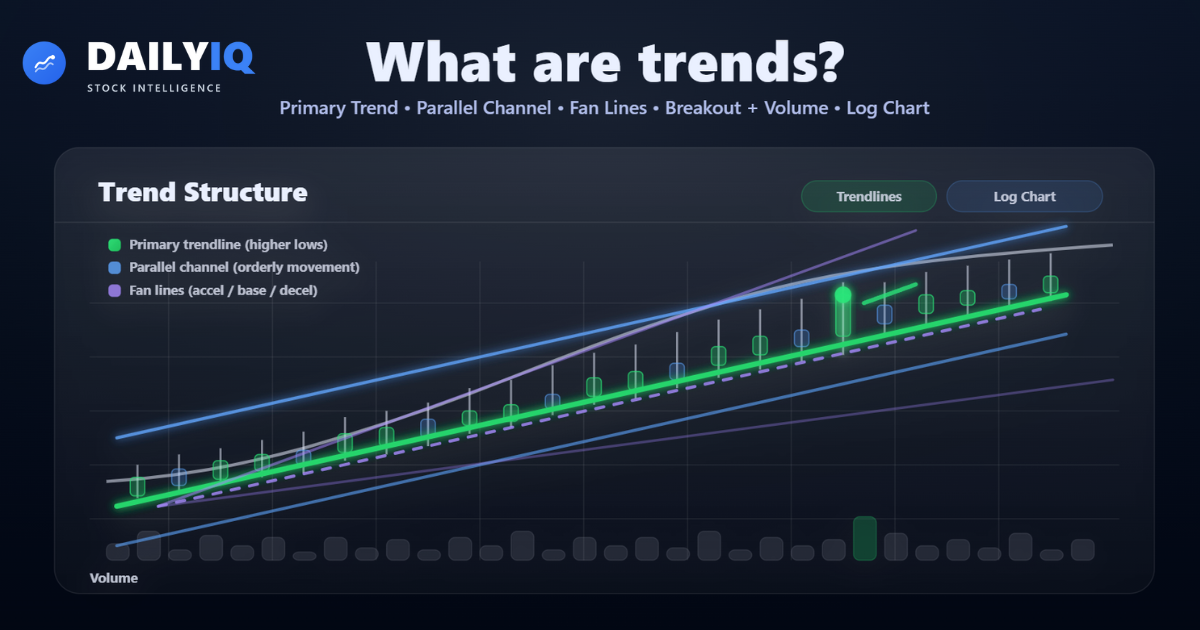
Trend Lines in Technical Analysis: The Complete Institutional Guide
Master trend lines, accelerating and decelerating structures, channels, log scale, Pitchfork, Gann fans, and professional breakout confirmation.
All Articles
Explore our featured analysis and strengthen your understanding of market structure
Trend Lines in Technical Analysis: The Complete Institutional Guide
Master trend lines, accelerating and decelerating structures, channels, log scale, Pitchfork, Gann fans, and professional breakout confirmation.
Feb 9, 2026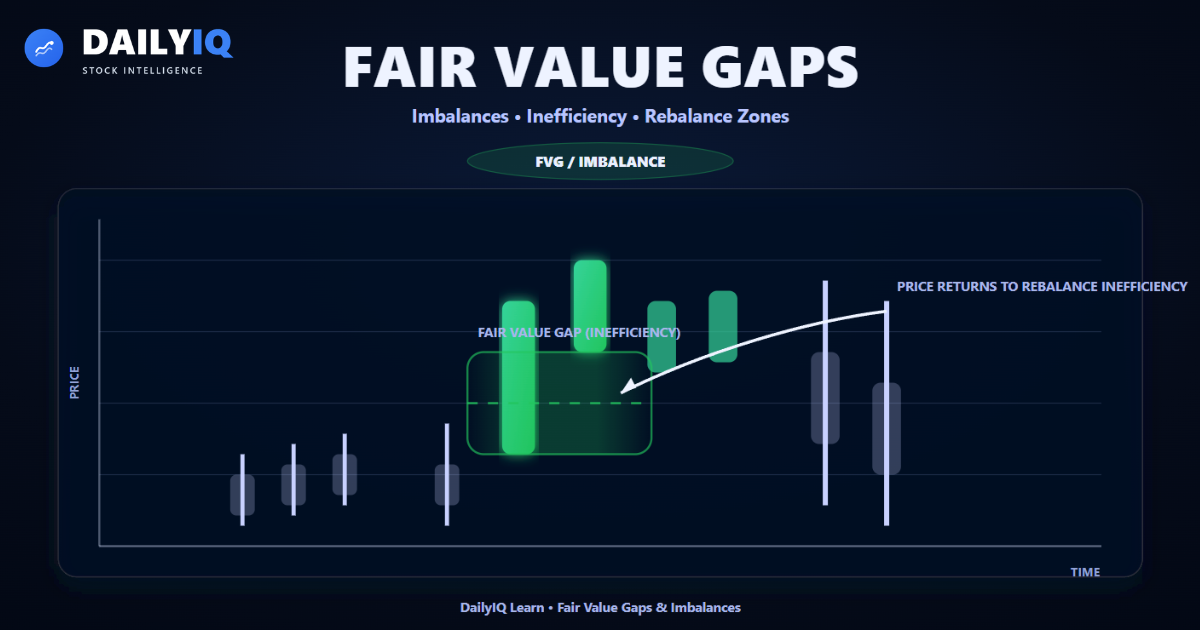
Fair Value Gaps, Imbalances, and Supply Demand Inefficiencies Explained
Learn how Fair Value Gaps (FVG), imbalances, and supply-demand inefficiencies form, why price revisits them, and how to use them for structured entries and risk.
Feb 20, 2026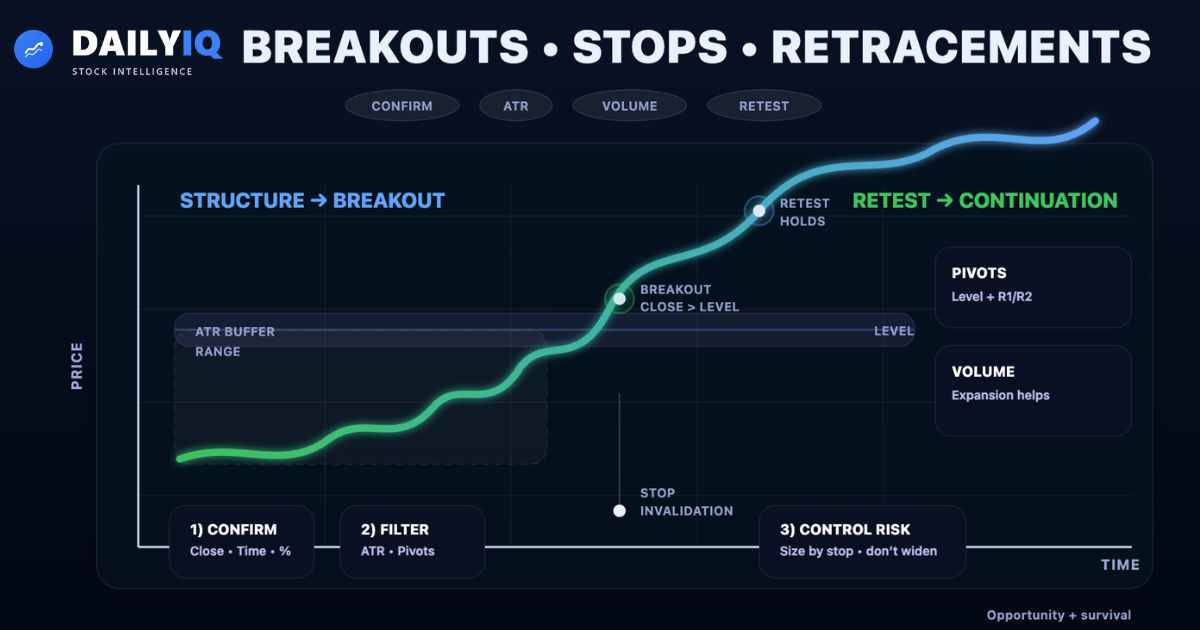
Breakouts, Stops & Retracements: The Institutional Trading Framework
Master breakout confirmation, volume analysis, volatility filters, ATR methods, pivot techniques, anticipation signals, and professional stop-loss management.
Feb 11, 2026
The Basic Principle of Technical Analysis - The Trend
Understand how trends form, why they matter, how they are identified, and the core assumptions technical analysts rely on when studying market price behavior.
Feb 4, 2026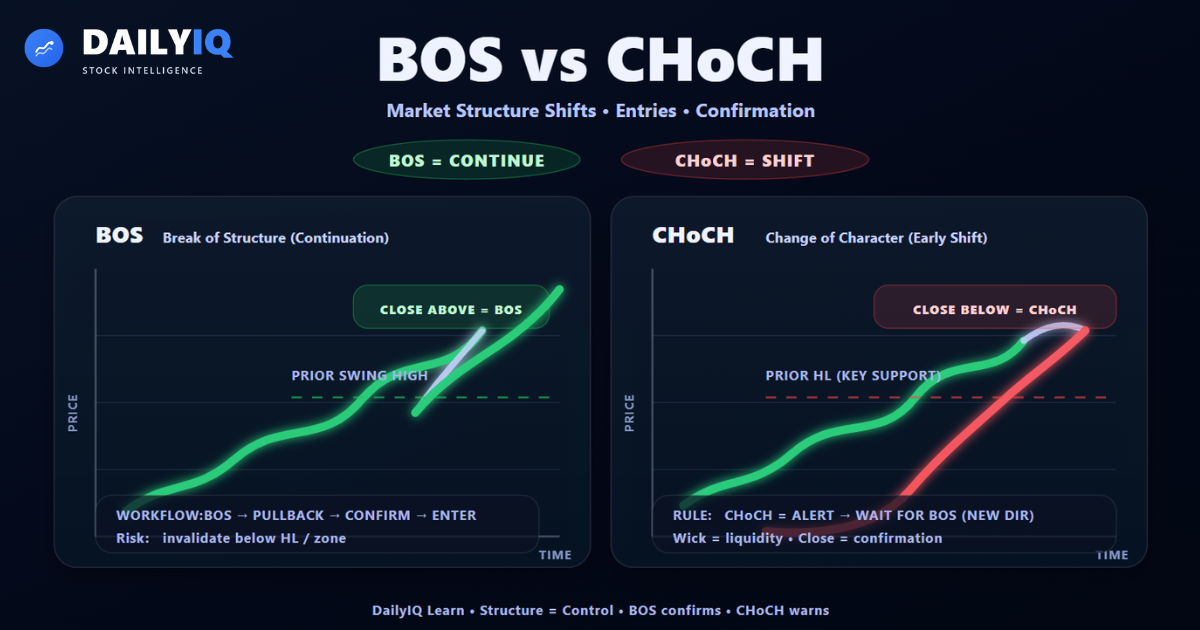
Break of Structure (BOS) and Change of Character (CHoCH) Explained
Learn how Break of Structure (BOS) and Change of Character (CHoCH) reveal trend continuation and reversals - and how smart money traders use them with liquidity and imbalances.
Feb 20, 2026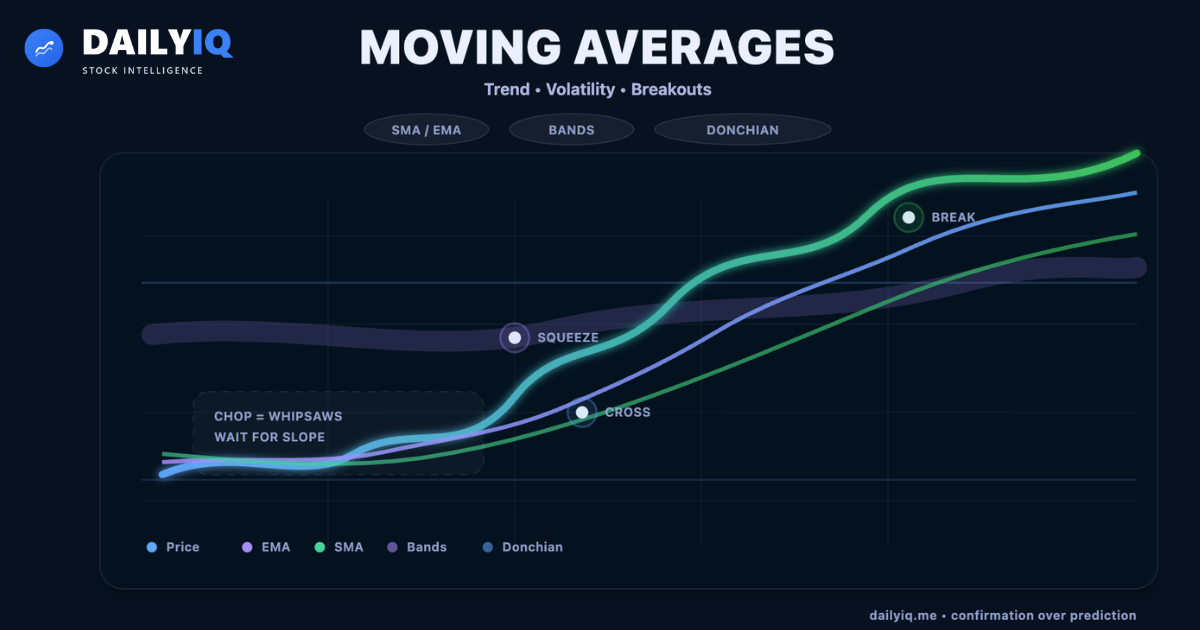
Moving Averages: Complete Guide to Trend Identification, Bands, Envelopes, and Breakout Channels
Master moving averages from core smoothing mechanics to advanced volatility tools. Learn SMA vs EMA, crossover signals, whipsaws, envelopes, Bollinger/Keltner/STARC bands, Donchian breakouts, and how institutions confirm trends and filter false signals.
Feb 14, 2026
What Are Order Blocks? Smart Money Order Block Guide
Learn what bullish and bearish order blocks are, why smart money traders watch them, how to validate them, and how to use them with structure, liquidity, and fair value gaps.
Mar 25, 2026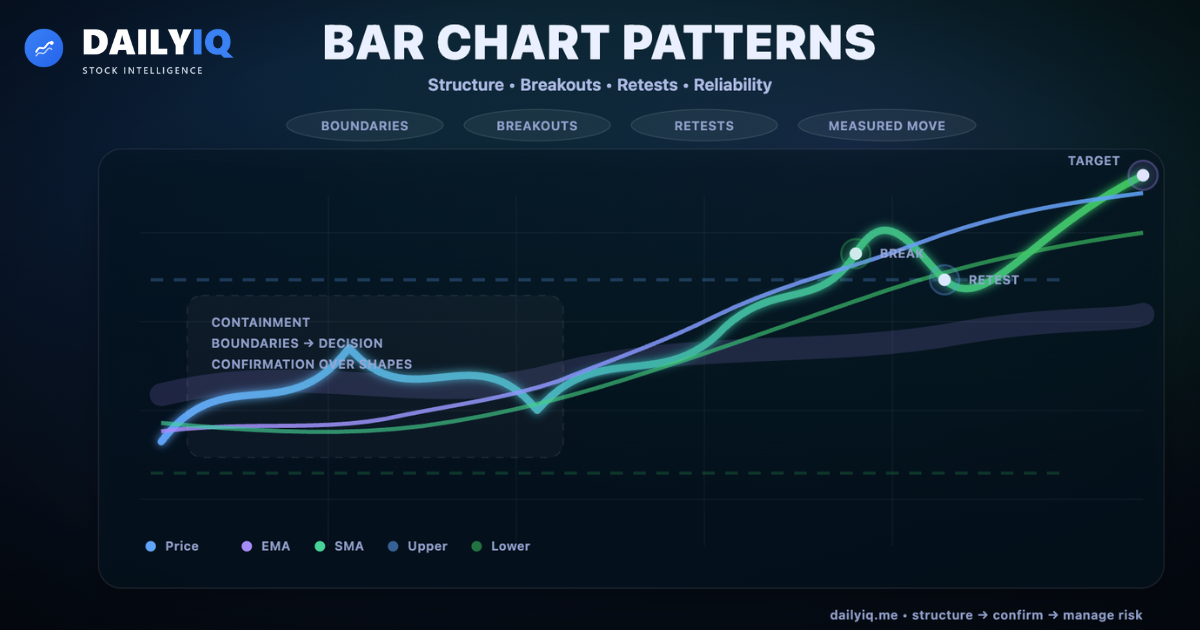
Bar Chart Patterns: Complete Guide to Structure, Breakouts, Retests, and Reliability
Master bar chart patterns from boundary definition to breakout confirmation. Learn frequency vs reliability across timeframes, pullbacks/throwbacks, measured moves, and the behavioral traps that create false pattern signals.
Feb 14, 2026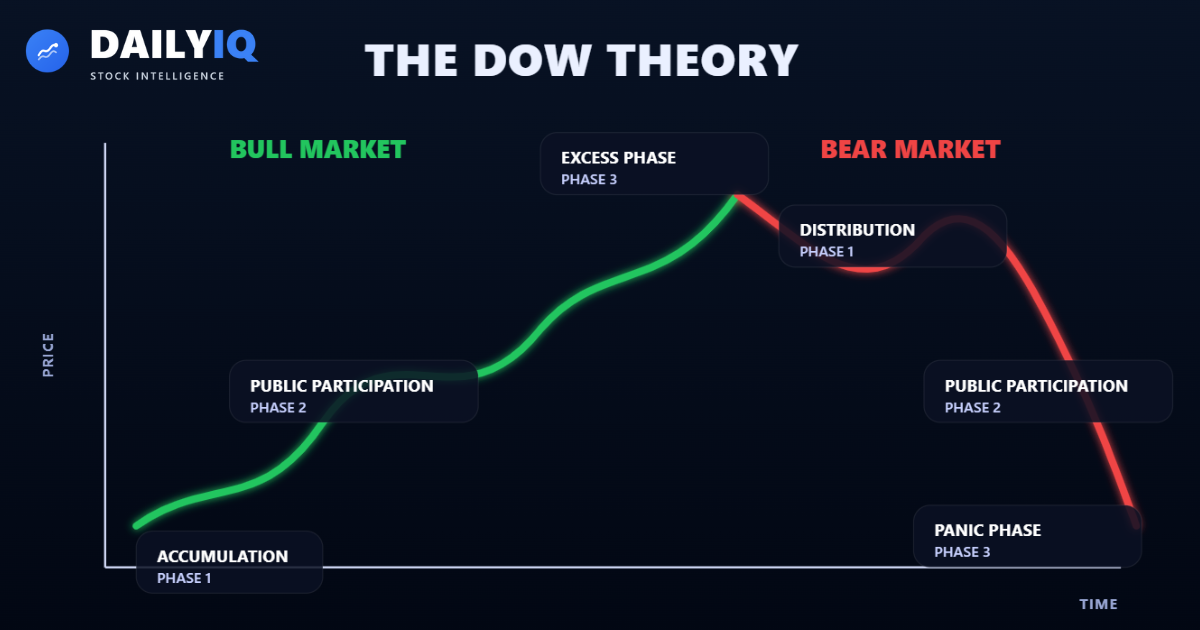
Dow Theory History, Theorems, Trends, Confirmation, Volume & Criticisms
A comprehensive and original deep dive into Dow Theory, including its historical roots, core theorems, trend classifications, confirmation principles, volume interpretation, criticisms, and modern relevance.
Feb 4, 2026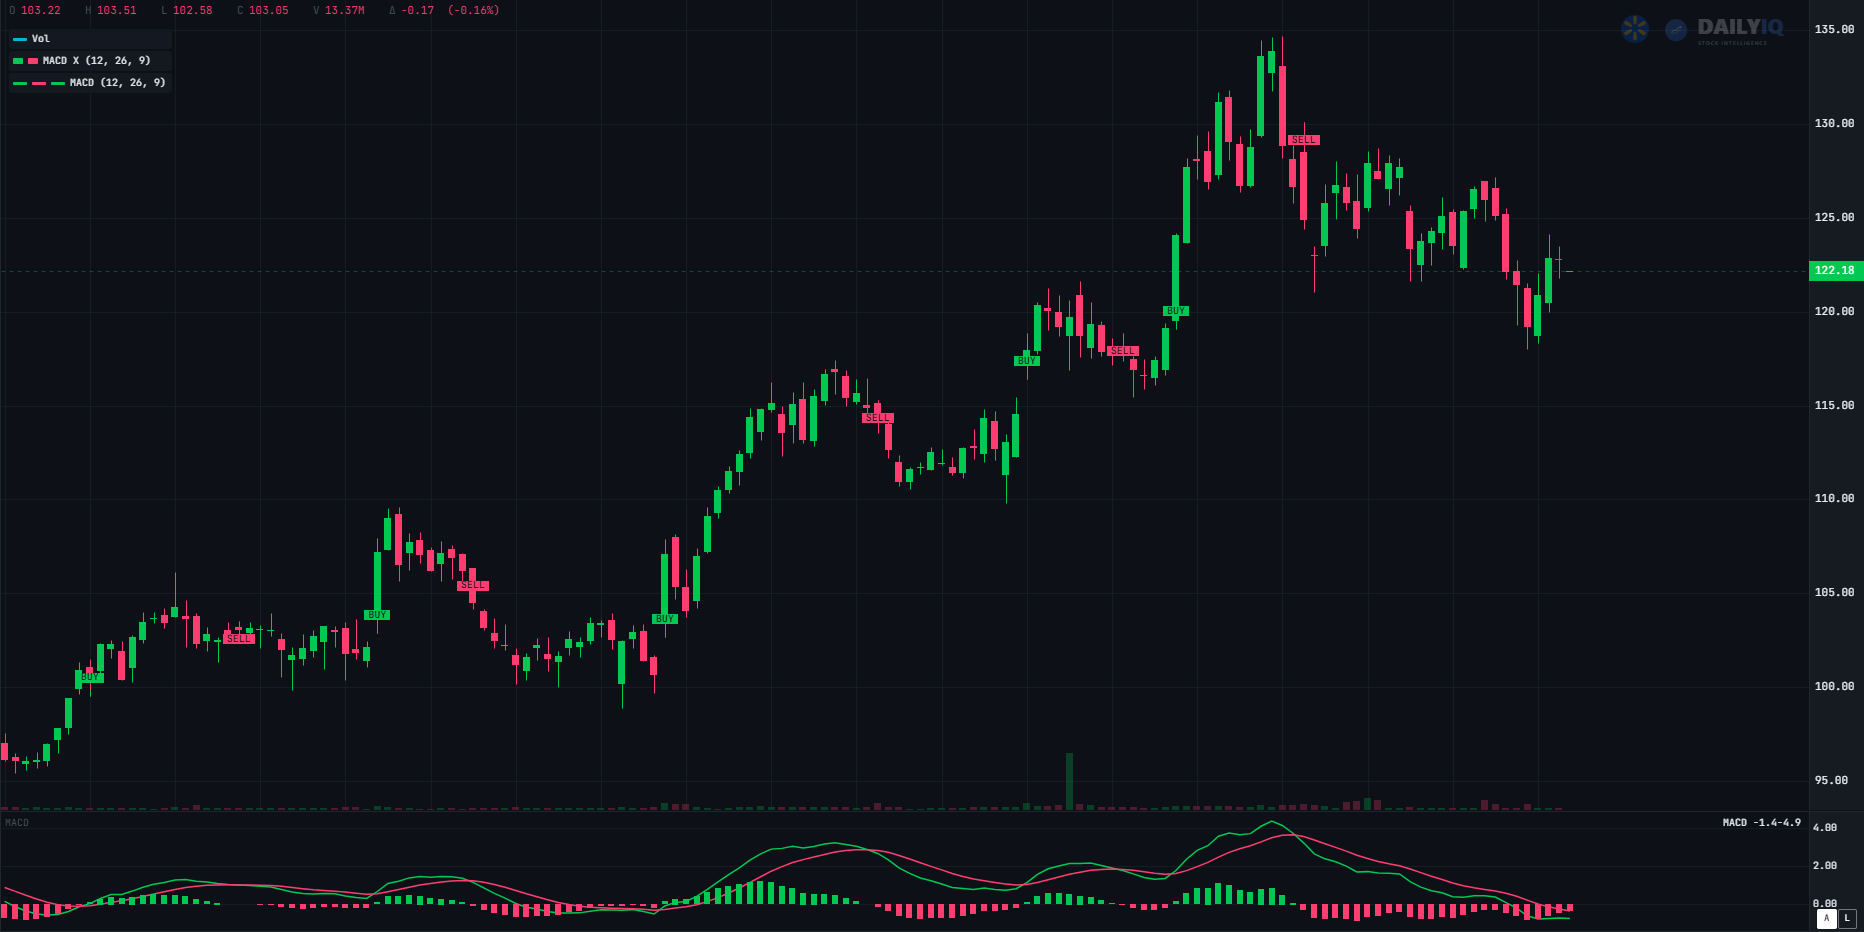
Volume in Trading Explained: Why Participation Matters
Learn how trading volume helps confirm breakouts, reveal conviction, frame price trends, and improve chart analysis across stocks and futures.
Mar 25, 2026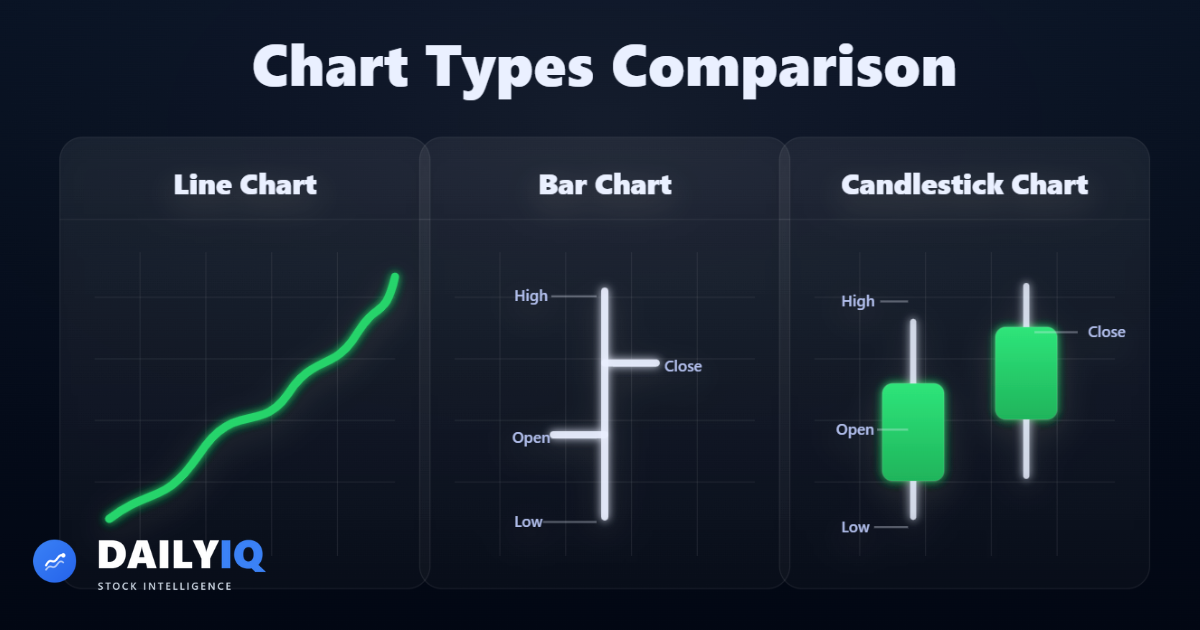
Introduction to Charts - Line, Bar & Candlestick Charts Explained
A complete beginner-to-intermediate guide to understanding how charts summarize price action, including line charts, bar charts, candlesticks, and data intervals.
Feb 4, 2026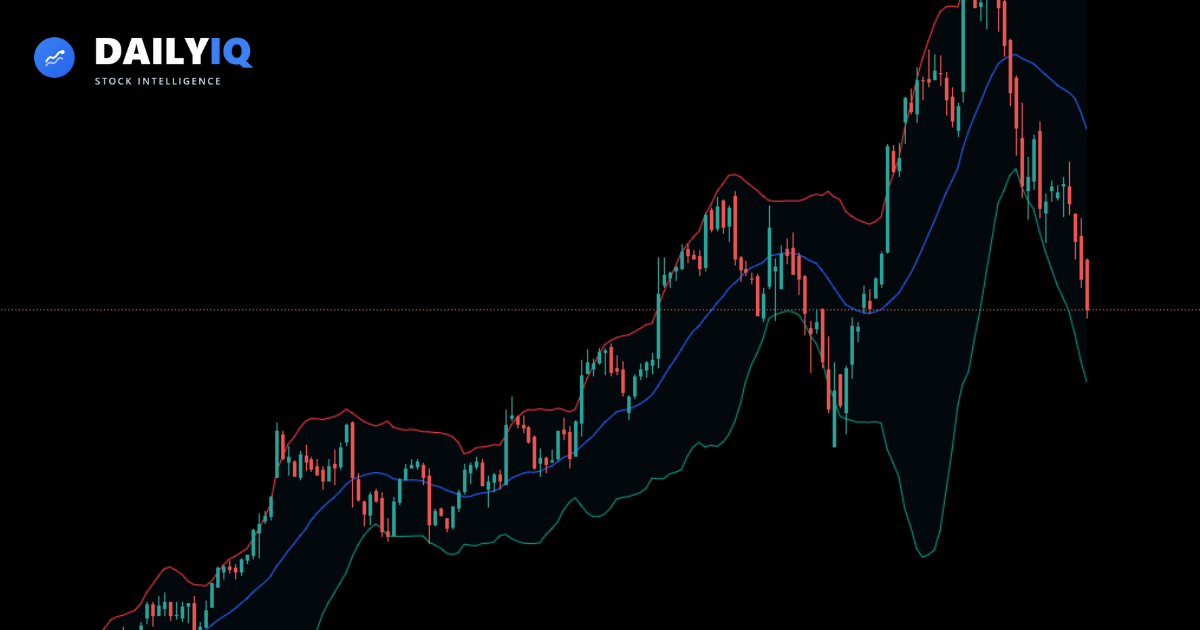
What Are Bollinger Bands and How to Read Them
Learn how Bollinger Bands measure volatility, identify breakouts, and highlight overextended price conditions.
Feb 3, 2026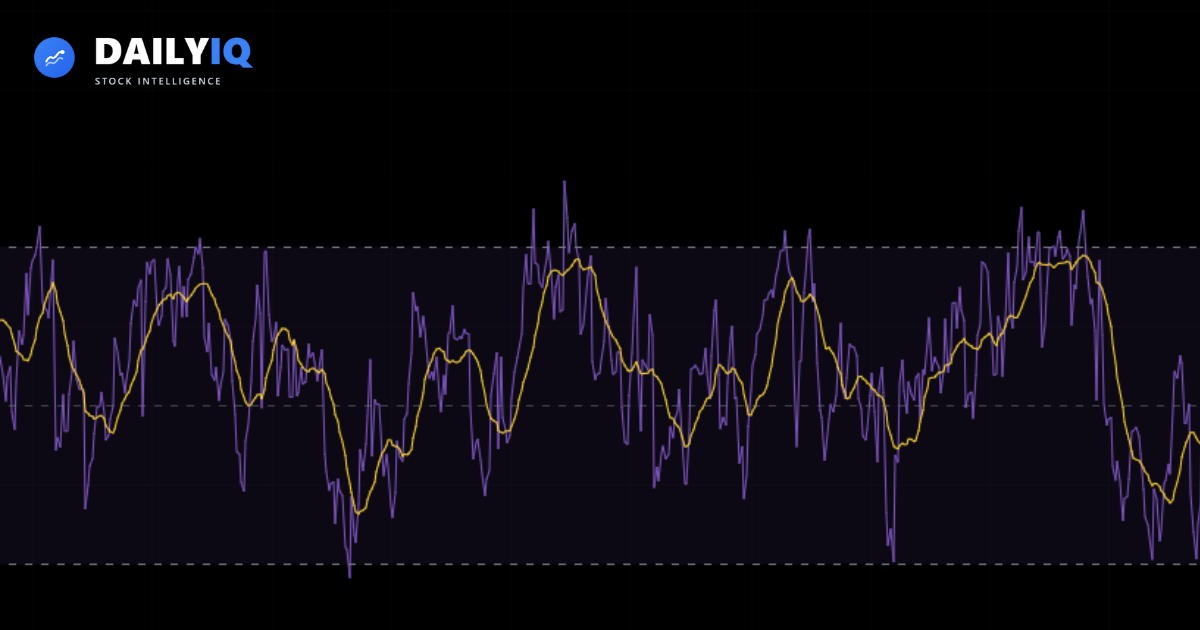
What Is RSI and How to Read It
Learn how the Relative Strength Index helps you measure momentum and identify overbought or oversold conditions.
Jan 30, 2026
What Is EMA and How to Read It
Learn how the Exponential Moving Average helps you identify trend direction, momentum shifts, and dynamic support or resistance.
Feb 3, 2026
Understanding MACD: A Beginner's Guide
Learn how MACD crossovers, histogram momentum, and divergence can help you read trend shifts.
Jan 28, 2026
What Are Heikin Ashi Candles and How to Read Them
Learn how Heikin Ashi candles smooth price action to help you identify trend strength, momentum shifts, and cleaner entries.
Feb 3, 2026
What Is ATR and How to Use It
Learn how the Average True Range (ATR) measures volatility and helps you set smarter stop losses and position sizes.
Feb 3, 2026
How Is Bitcoin Priced?
Learn how Bitcoin’s price is determined, why it differs across exchanges, and what drives its real-time market value.
Feb 3, 2026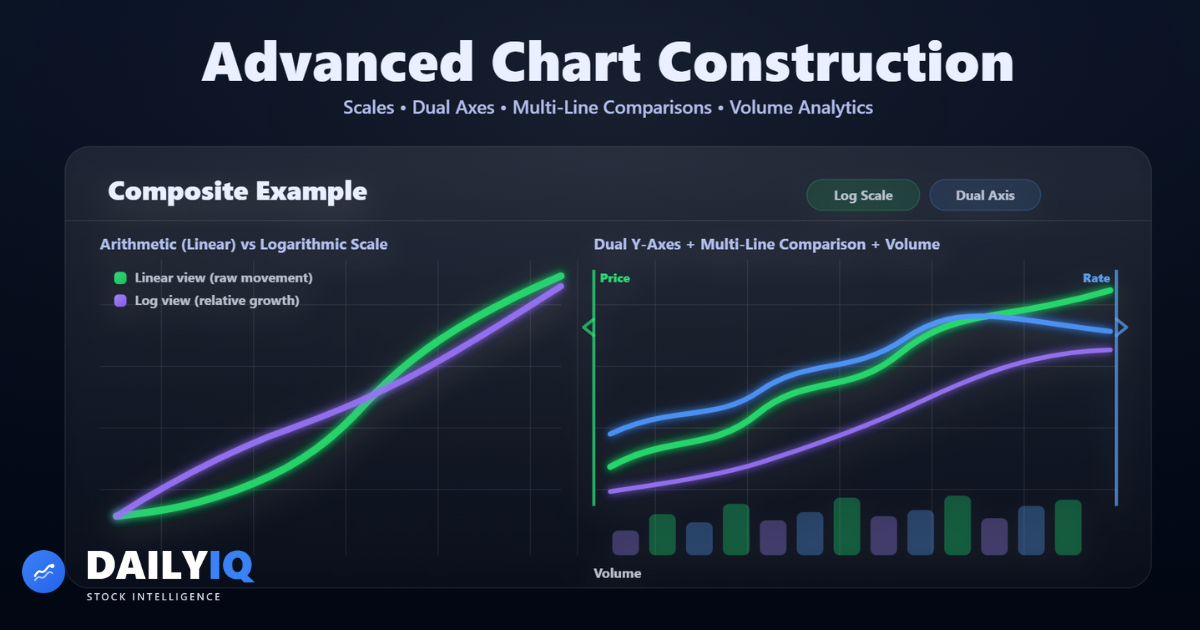
Advanced Chart Analysis: Scaling, Volume, and Comparative Charting Explained
A comprehensive guide to advanced chart construction including arithmetic vs logarithmic scales, dual y-axes, multi-line comparisons, and volume-based charting techniques.
Feb 7, 2026Want to Learn More?
Explore our glossary and FAQ to build your investing foundation.