What Are Bollinger Bands and How to Read Them
Learn how Bollinger Bands measure volatility, identify breakouts, and highlight overextended price conditions.

Introduction To What Are Bollinger Bands and How to Read Them
Bollinger Bands measure volatility - not direction. That distinction matters. The same upper-band touch can mean strength in a trend or exhaustion in a range, so context determines what the signal actually means.
Bollinger Bands are one of the most widely used volatility indicators in technical analysis. They help traders understand when price movement is expanding, contracting, or becoming stretched relative to its recent average. Unlike momentum indicators such as RSI, Bollinger Bands focus on volatility - how much price is moving - rather than just direction.
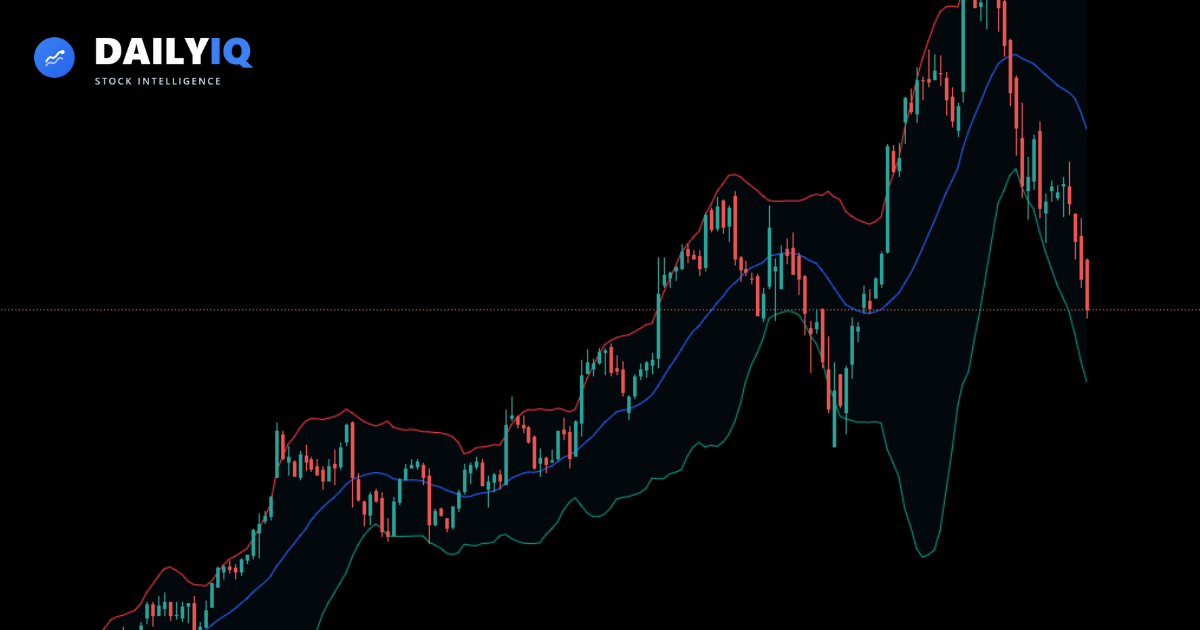
The indicator consists of three lines:
- A middle line (typically a 20-period moving average)
- An upper band
- A lower band
The upper and lower bands expand when volatility increases and contract when volatility decreases.
This helps traders answer an important question:
- Is price becoming unusually extended relative to recent behavior?
- Bollinger Bands do not predict direction by themselves. Instead, they provide structure and context around price movement.
How Bollinger Bands work
Bollinger Bands are calculated using two key components:
- A moving average (most commonly 20 periods)
- Standard deviation (typically set to 2)
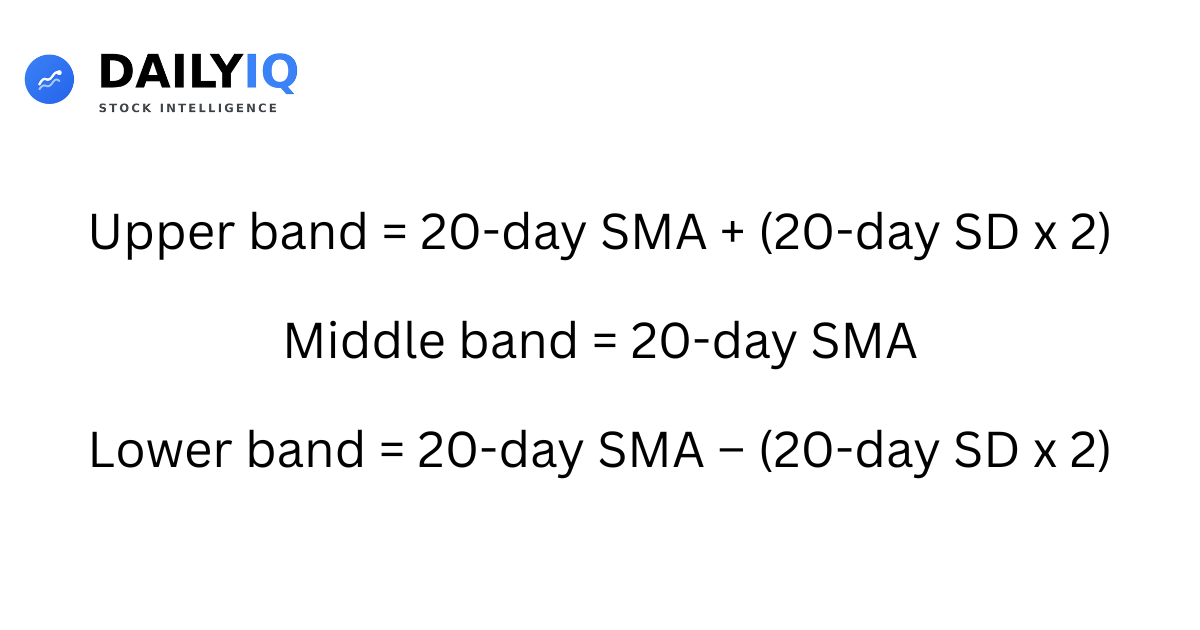
The formula is:
Upper Band = Moving Average + (2 × Standard Deviation)
Lower Band = Moving Average − (2 × Standard Deviation)
Standard deviation measures how far price typically moves away from its average. When price swings grow larger, standard deviation increases and the bands widen. When price movement tightens, standard deviation decreases and the bands narrow.
Because the bands adjust dynamically, they reflect real-time volatility instead of fixed levels.
When volatility rises → bands widen.
When volatility falls → bands tighten.
Reading Bollinger Band signals
Bollinger Bands are commonly interpreted in three primary ways:
- Band touches
- The squeeze
- Breakout expansion
Price touching the upper band
When price reaches or closes near the upper band, it signals strong upside pressure relative to recent volatility.
However, touching the upper band does not automatically mean price will reverse.
In strong uptrends:
- Price can “ride the upper band” for extended periods.
- Multiple touches may confirm trend strength.
- Selling too early can mean exiting strong momentum.
In sideways markets:
- Upper band touches may signal short-term overextension.
- Price may rotate back toward the middle band.
Context determines whether a band touch reflects strength or exhaustion.
Price touching the lower band
When price reaches or closes near the lower band, it signals strong downside pressure.
In range-bound markets:
- Lower band touches can lead to short-term rebounds.
In strong downtrends:
- Price may continue hugging the lower band.
- Oversold conditions can persist longer than expected.
Band touches show volatility expansion - not guaranteed reversal.
The Bollinger Band squeeze
One of the most powerful concepts in Bollinger Band analysis is the squeeze.
A squeeze occurs when the bands contract significantly due to declining volatility.
Low volatility often precedes high volatility.
When the bands tighten:
- Market movement has compressed.
- Energy is building.
- A breakout may follow.
The squeeze does not tell you which direction price will move - only that expansion is likely.
Traders often combine squeeze setups with:
- Volume confirmation
- Breakout above resistance or below support
- Trend alignment from moving averages
The key idea: contraction often leads to expansion.
The middle band (moving average)
The middle band acts as a dynamic reference point.
In uptrends:
- Pullbacks often find support near the middle band.
- It can act as a continuation entry area.
In downtrends:
- Rallies may fail near the middle band.
- It can act as dynamic resistance.
Rather than focusing only on the outer bands, many traders watch how price reacts to the middle band within trends.
Bollinger Bands in trending vs ranging markets
Bollinger Bands behave differently depending on market structure.
In range-bound markets:
- Price often oscillates between upper and lower bands.
- Mean reversion strategies may work better.
In strong trending markets:
- Price may repeatedly touch one band.
- Reversal signals become less reliable.
- The middle band becomes more important than the outer bands.
Understanding whether the market is trending or ranging prevents misinterpretation.
Bollinger Bands vs other indicators
Bollinger Bands measure volatility - not momentum or direction.
Because of this, traders often combine them with:
- RSI (to measure momentum strength)
- Moving averages (to confirm trend direction)
- Volume analysis (to validate breakout strength)
- MACD (to compare momentum acceleration)
For example:
- A band squeeze + rising volume may confirm breakout potential.
- Upper band touch + bearish RSI divergence may signal weakening momentum.
Volatility and momentum together provide stronger insight.
How DailyIQ uses Bollinger Bands
DailyIQ treats Bollinger Bands as a volatility state indicator rather than a signal generator. The width of the bands - whether they are expanding, contracting, or stable - tells the system something about the current environment before any directional signal is evaluated.
A squeeze is given elevated attention not because it predicts a breakout, but because compressed volatility typically precedes expansion. When the squeeze is confirmed by trend alignment and early volume shifts, it increases confidence in other bullish or bearish readings within the score. Volatility expansion against the prevailing trend direction is treated as a caution flag - the move may be strong, but it is often less sustainable than expansion in the direction of trend.
Practical takeaways
The most common mistake with Bollinger Bands is treating the outer bands as reversal levels. They are not horizontal support or resistance - they are dynamic volatility boundaries. In a trending market, price can hug the upper or lower band for an extended period because the trend itself is what is holding price near the band, not some arbitrary ceiling or floor.
The middle band is more useful in trends than most traders give it credit for. A pullback that holds the 20-period moving average and then resumes in trend direction is one of the cleaner setups Bollinger Bands help identify. The squeeze setup is valuable, but it requires patience - waiting for the actual breakout and volume confirmation rather than anticipating direction before the move begins.
The Bollinger squeeze in depth
The Bollinger squeeze is one of the most compelling setups the indicator produces, and it deserves more detail than a simple mention. The squeeze occurs when the distance between the upper and lower bands — the bandwidth — contracts to an unusually narrow level, signaling that the market has entered a phase of abnormally low volatility.
Why squeezes precede significant moves
Markets alternate between trending (directional) phases and consolidating (low-volatility) phases. During consolidation, ATR falls, Bollinger Band width narrows, and price compresses into an increasingly tight range. This compression represents energy building — participants on both sides accumulate positions without enough conviction to break price in either direction. Eventually, one side wins decisively, and the compression resolves in a volatile breakout.
The Bollinger squeeze identifies these pre-breakout conditions early by flagging when band width has fallen to historically low levels for that specific instrument. A 6-month or 12-month lookback for band width is a useful context period.
What the squeeze does NOT tell you
The squeeze does not indicate direction. After a prolonged squeeze, price is equally likely to break upward or downward. Traders who enter positions before the squeeze breaks in the hope of catching the move in both directions (strangle strategies) may be disappointed when the breakout occurs but reverses quickly.
How to use the squeeze practically
The most effective approach is to use the squeeze to draw your attention and then wait for directional confirmation:
- Identify the squeeze (bandwidth at multi-month low)
- Identify the direction of the potential breakout based on trend bias, volume, and price action within the squeeze
- Wait for price to break beyond the upper or lower band with a confirming candle close
- Enter in the direction of the break with volume confirmation
The pause between identifying the squeeze and acting on the confirmed breakout is where most of the discipline is required.
Walking the bands in strong trends
One of the most commonly misunderstood Bollinger Band behaviors is what happens in extremely strong trending markets. Price can hug the upper or lower band for extended periods — sometimes 10, 20, or even 30 consecutive days — without triggering a reversal. This is called 'walking the bands.'
Why walking the bands is a sign of strength, not excess
When price walks the upper band, it means the rate of price appreciation is consistently generating new price levels that approach or touch the upper standard deviation boundary. Far from being overbought in a mean-reversion sense, this behavior signals that buying pressure is so strong it continues producing new highs faster than the moving average can catch up.
In strong uptrends, every touch of the upper band is simply the next step in the trend. Selling because price is at the upper band in a walking-the-band situation is equivalent to selling strength in a momentum market — a consistently costly mistake.
How to identify walking the bands vs a reversal setup
Walking the bands looks like repeated closes at or near the upper band, with the middle band rising steadily, band width expanding (not contracting), and RSI holding in the upper range (50-80) without turning down. The pattern is one of consistent strength.
A potential reversal from band walking typically involves:
- A close below the middle band on meaningful volume
- RSI failing to make a new high alongside a price new high (bearish divergence)
- A significant increase in selling volume on a day when price reverses from the upper band sharply
Until these conditions appear, the appropriate posture in a band-walking trend is to hold long positions and use pullbacks toward the middle band as potential add-on entries, not as reasons to exit.
Bollinger Band breakout trades
Breakout trading with Bollinger Bands involves entering when price moves outside the bands after a squeeze or consolidation period. The band breakout signals that the balance of supply and demand has shifted decisively and that a directional move may be beginning.
What makes a high-quality BB breakout
The strongest Bollinger Band breakouts share several characteristics:
- They occur after a clear squeeze (band width recently compressed)
- They are accompanied by a significant volume expansion — typically 2× or more the recent average volume
- The closing price is clearly outside the band, not just a brief intraday pierce that reverses
- The breakout direction aligns with the higher timeframe trend or has fundamental catalyst support
A breakout above the upper band on heavy volume after a 3-month squeeze in a stock with improving fundamentals is among the highest-conviction technical setups available.
The 3-sigma concept
Standard Bollinger Bands use 2 standard deviations, meaning roughly 95% of all price action occurs within the bands under normal conditions. A close above the upper band represents an unusual degree of buying pressure — price is in territory that occurs only 5% of the time statistically.
Some traders use a second set of bands at 3 standard deviations. A price move to the 3-sigma band is even more unusual and often signals a price extreme that is difficult to sustain — either a very strong trend or an overextended move that will revert. The 3-sigma band can be useful for identifying when to take partial profits on a position that has already moved substantially in your favor.
Failed breakouts
A failed breakout occurs when price closes outside the band but then quickly retreats back inside. This failure can be more actionable than the original breakout — it signals a bull trap (for failed upside breaks) or a bear trap (for failed downside breaks). The failed breakout tells you that the liquidity at the breakout level was insufficient to sustain the move, and a sharp reversal often follows.
%B indicator and bandwidth
Beyond the basic Bollinger Band visualization, two derived indicators — %B and bandwidth — provide additional quantitative context that can improve signal quality.
%B: Where is price within the bands?
%B measures where price is relative to the bands as a percentage from 0 to 1 (and sometimes beyond):
- %B = 1.0 means price is at the upper band
- %B = 0.5 means price is at the middle band (moving average)
- %B = 0.0 means price is at the lower band
- %B above 1.0 means price is above the upper band (extremely strong buying)
- %B below 0.0 means price is below the lower band (extremely strong selling)
%B provides a precise, quantified measure of where price sits within the band structure at any moment. This allows systematic scanning — you can screen for stocks where %B is below 0.1 (near the lower band) in an uptrending market to find potential oversold setups.
%B above 0.8 in a trending market confirms strong momentum. %B cycling between 0.4 and 0.9 in an uptrend is the signature of a healthy trend with normal pullbacks that find support near the middle band.
Bandwidth: Quantifying volatility
Bandwidth measures the width of the Bollinger Bands as a percentage of the middle band:
Bandwidth = (Upper Band - Lower Band) / Middle Band
Tracking bandwidth over time creates a volatility history for the instrument. When bandwidth falls to its lowest reading in 6 or 12 months, a squeeze condition exists. When bandwidth is at or near its highest reading in that window, volatility is expanded and the current move may be at or near its peak.
Bandwidth is most useful as a filter: entering positions when bandwidth is at multi-month lows (into a squeeze) and avoiding new entries when bandwidth is at multi-month highs (when volatility is already fully expanded) tends to improve the risk-reward profile of trades.
Combining Bollinger Bands with RSI
Bollinger Bands and RSI are natural complements because they measure different aspects of price behavior: bands measure volatility and relative price extension, RSI measures momentum velocity. Their combination creates more complete setups than either indicator generates alone.
The classic overbought/oversold confirmation
The most commonly taught combination is to look for price at the upper or lower band while RSI simultaneously shows an extreme reading. The logic is that both the volatility measure (band position) and the momentum measure (RSI level) confirm the same condition.
However, as noted earlier, in trending markets this combination produces many false reversals because both indicators can remain at extremes for extended periods. The combination is most reliable in range-bound markets where mean reversion is the dominant regime.
Divergence into band extremes
A more powerful and reliable combination is RSI divergence at band extremes. When price reaches the upper band while RSI fails to make a new high (bearish RSI divergence), the combination is far more actionable than price at the band alone. The band position tells you price is extended; the RSI divergence tells you the momentum supporting that extension is fading.
This combination — band extreme plus RSI divergence — is one of the strongest reversal signals available in technical analysis, particularly when it occurs at a major structural resistance level.
Squeeze plus RSI midpoint
As a breakout entry refinement, look for a Bollinger squeeze where RSI is hovering near the midpoint (45-55 range). RSI at the midpoint suggests the market is genuinely undecided — not trending strongly in either direction. When the squeeze resolves, RSI often begins moving decisively in the breakout direction. Entering on the band breakout when RSI is confirming by moving from the midpoint in the same direction adds momentum confirmation to the volatility breakout signal.
Band Touches Are Not Reversals
In a strong trend, price can walk along the upper or lower band for many candles without reversing. Treating every touch as a sell or buy signal in a trending market leads to repeated early exits. Identify the market regime before deciding what a band touch means.
The Squeeze Signals Potential, Not Direction
When the bands narrow significantly, volatility is compressed and a larger move is often building. The squeeze tells you to pay attention - not which way to trade. Use volume, trend alignment, and breakout level to determine direction after the squeeze signals potential.
Use the Middle Band in Trends
In trending conditions, the 20-period middle band often acts as a dynamic pullback level more useful than the outer bands. Pullbacks that hold the middle band and resume trend direction are one of the cleaner Bollinger Band setups available.
Quick FAQ
Does touching the upper or lower band mean reversal?
Not by itself. In strong trends, price can ride a band for longer than expected. Treat touches as context, then confirm with structure and momentum.
How do I trade a Bollinger squeeze better?
Wait for expansion plus confirmation: breakout level, volume pickup, and trend alignment. A squeeze signals potential movement, not guaranteed direction.
Are default settings always best?
20 periods and 2 standard deviations are a good baseline, but settings should match asset volatility and timeframe. Optimize for consistency, not maximum signal count.
What works better in trends: bands or middle line?
In trends, the middle line often provides cleaner continuation context than raw outer-band touches. Outer bands are more useful for volatility state and extension.
What confirms a high-quality Bollinger setup?
Trend structure, momentum agreement, and clean invalidation levels. Without those, band signals are easier to misread.
DailyIQ publishes market education, score methodology, and research workflows to help users understand what the platform is measuring. Content is for informational purposes only and is not investment advice or a recommendation to buy or sell any security.
Use education with process, not in isolation
See how DailyIQ combines technical indicators, news sentiment, freshness checks, and editorial review to decide what gets surfaced and indexed.
Learn About Investing
These resources can help investors evaluate momentum, volatility, and trend strength when analyzing What Are Bollinger Bands and How to Read Them.
 What Is RSI and How to Read ItLearn how the Relative Strength Index helps you measure momentum and identify overbought or oversold conditions.Technical · 16 min read
 Understanding MACD: A Beginner's GuideLearn how MACD crossovers, histogram momentum, and divergence can help you read trend shifts.Technical · 16 min read