Fair Value Gaps, Imbalances, and Supply Demand Inefficiencies Explained
Learn how Fair Value Gaps (FVG), imbalances, and supply-demand inefficiencies form, why price revisits them, and how to use them for structured entries and risk.

Introduction To Fair Value Gaps, Imbalances, and Supply Demand Inefficiencies
Use this guide as a practical framework. Treat Fair Value Gaps as locations, not automatic signals, and pair them with trend structure, volatility context, and predefined risk rules.
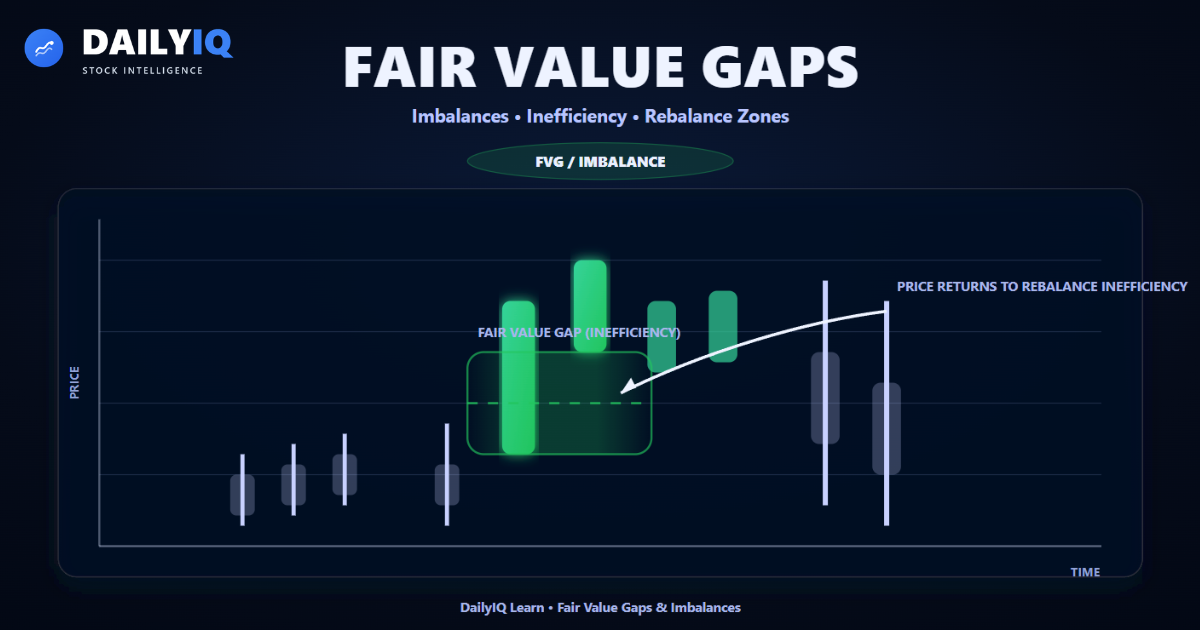
A Fair Value Gap (FVG) is a chart-visible footprint of inefficient price discovery.
It forms when price moves so quickly in one direction that normal two-sided trading is skipped. In other words, the market “jumps” through a range of prices without spending time trading there.
That “skipped” range becomes an imbalance zone.
Why traders care:
- FVGs often act like “magnets” because markets frequently revisit inefficiencies.
- They provide clean, structured areas to wait for pullbacks instead of chasing.
- They help explain why trends often retrace even when fundamentals haven’t changed.
- They can improve risk-reward by defining a zone for invalidation and stops.
But the most important idea is this:
An FVG is not a guarantee.
It is evidence that one side of the auction was temporarily dominant.
When you combine FVG zones with trend and structure, they become powerful planning tools.
What an imbalance really means
An imbalance is not just a big candle.
It is a condition where the market did not trade evenly in both directions. In a healthy auction, price moves, pauses, and overlaps. Buyers and sellers interact across many prices, producing a “thick” trading distribution.
In an imbalance:
- one side becomes aggressive (market orders dominate)
- the other side is passive or absent (limit liquidity is thin)
- price jumps through levels to find the next pool of liquidity
This is why imbalances are often associated with:
- breakouts and trend legs
- news-driven repricing
- liquidation events
- large participant execution
The chart version of this is simple: you see speed and displacement.
But the underlying reason is deeper: the market is searching for liquidity because the current level cannot absorb the demand (or supply).
So when we say “FVG is an inefficiency,” we mean:
Price discovered a new area too quickly, leaving behind a zone where the auction was incomplete.
How Fair Value Gaps are defined on a chart
The popular “FVG” definition is a clean, repeatable way to mark inefficiency using three candles.
Bullish FVG (3-candle)
- Candle 2 is an impulse up candle
- Candle 3’s low is above Candle 1’s high
- The “gap” between Candle 1 high and Candle 3 low is the FVG zone
Bearish FVG (3-candle)
- Candle 2 is an impulse down candle
- Candle 3’s high is below Candle 1’s low
- The “gap” between Candle 3 high and Candle 1 low is the FVG zone
Why this works:
It captures the idea that price moved so fast it skipped overlap between Candle 1 and Candle 3. That’s the visual signature of thin trading.
Important note:
Different traders mark FVGs slightly differently (some use candle bodies, some use wicks). The exact method matters less than consistency. Your system must use one approach reliably.
Supply and demand: the real engine behind FVGs
“Supply and demand” is often explained too simply, like a textbook curve.
In real markets, supply and demand show up as order flow:
- buyers are willing to pay up (market buys)
- sellers are willing to hit bids (market sells)
- passive liquidity sits as limit orders (bids and offers)
An imbalance happens when aggressive orders overwhelm passive liquidity.
Example:
If there aren’t enough sellers at the current level and buyers keep buying, price must move up to find sellers.
That movement creates the footprint:
- displacement candle(s)
- reduced overlap
- FVG / inefficiency zone
So FVGs are not “mystical ICT zones.”
They are a chart way to mark where supply and demand were temporarily out of balance.
This also explains why FVGs can fail:
If the market regime changes (trend shifts, volatility explodes, or structure breaks), the supply/demand relationship changes and the old imbalance may stop mattering.
Why price revisits imbalances: rebalancing and liquidity
Price revisits imbalances because markets are liquidity-seeking.
Large participants often cannot complete execution in one candle. If the market jumps quickly, they may:
- get partially filled
- push price too far from fair value temporarily
- leave untraded prices behind
Later, as liquidity conditions change, price returns into those zones.
That return is called rebalancing (or “filling the gap”).
Common sequence:
- Impulse move creates imbalance
- Price continues briefly (momentum)
- Market pulls back to rebalance
- Trend resumes if structure remains intact
This is why FVGs are useful:
They give you a defined area to watch for a pullback rather than buying the top of a candle.
However:
Some imbalances do not fill quickly (or at all), especially during strong trends or major events. That’s why confirmation is always required.
Bullish vs bearish Fair Value Gaps (and what they act like)
A bullish and bearish FVG are the same concept in opposite directions.
Bullish FVG
- Created by aggressive buying
- Often behaves like a support zone on pullbacks
- More reliable in uptrends where higher highs and higher lows are intact
- Often used to re-enter after a breakout
Bearish FVG
- Created by aggressive selling
- Often behaves like resistance on retraces
- More reliable in downtrends where lower lows and lower highs are intact
- Often used to re-enter after breakdowns
The key is context:
A bullish FVG inside a strong uptrend is usually more meaningful than a bullish FVG forming inside a messy sideways range.
Likewise, bearish FVGs work best when structure is already bearish.
Treat them as trend-following tools unless a clear structural shift occurs.
Partial fills vs full fills (and why perfection is a trap)
A common beginner mistake is waiting for “perfect fills.”
In real markets, fills are probabilistic and depend on:
- strength of trend
- volatility regime
- liquidity conditions
- nearby structure (highs/lows, prior ranges)
- time of day (for intraday markets)
Two main fill behaviors occur:
Partial fill
- price enters the zone, reacts, and continues
- more common in strong trends (momentum is high)
- often happens when buyers/sellers are still active and defend early
Full fill
- price trades through the entire zone
- more common when trend is weaker or the market is range-bound
- can happen when the market needs deeper liquidity to continue
This is why your plan should be:
- Mark the FVG zone.
- Decide the invalidation level (where your idea fails).
- Wait for confirmation instead of assuming the first touch will work.
Where FVGs fit inside market structure
A Fair Value Gap becomes far more useful when it is connected to structure.
Structure answers:
- Is the market making higher highs / higher lows?
- Did we break a key swing high or low?
- Are we trending or ranging?
FVG answers:
- Where did price move inefficiently?
- Where might the market rebalance and continue?
In a clean uptrend:
- A bullish FVG that forms during a breakout leg is often a re-entry zone.
- If price pulls back into it while structure remains bullish, continuation is more likely.
In a downtrend:
- A bearish FVG after breakdown can act as resistance.
- A retrace into it is often where sellers re-engage.
In a range:
- Many FVGs fill quickly and don’t lead to continuation.
- The market is balanced, so inefficiencies get repaired more often.
So the “best use” is:
Use structure to choose direction. Use FVG to choose location.
Multiple timeframe Fair Value Gaps
Not all FVGs have equal importance.
A weekly FVG is not the same as a 5-minute FVG.
Higher timeframe gaps often represent:
- larger institutional positioning
- more meaningful repricing
- broader liquidity events
Lower timeframe gaps can represent:
- intraday momentum shifts
- short-term liquidity runs
- micro rebalancing zones
A high-quality approach:
- Identify trend and key levels on the higher timeframe (daily/4H/weekly)
- Mark major FVG zones that align with that direction
- Use a lower timeframe (15m/5m) to time entries inside the HTF zone
This method improves:
- precision of entries
- clarity of invalidation
- risk efficiency
It also prevents a common mistake: trading every small gap you see.
Practical ways traders use FVG zones
There are many “styles” of using FVGs. The core concept stays the same, but execution differs.
Here are practical approaches that work across styles:
1) Pullback entry in trend
- Identify trend direction (EMA structure or swing highs/lows)
- Mark the most recent “clean” imbalance created by displacement
- Wait for price to return into the zone
- Enter after confirmation (candle close / reclaim / structure)
This approach is designed to avoid chasing and improve entries.
2) Targeting / magnet zones
Traders sometimes treat unfilled FVGs as “magnets.”
If price is moving toward an old inefficiency, it can act as a natural target area.
This is not guaranteed, but it can support trade planning:
- “If price reaches this unfilled FVG, I’ll reduce size or take partial profit.”
- “If price fills the gap and rejects, I’ll watch for continuation.”
3) Risk framing and invalidation
Even if you don’t trade FVGs directly, they can help define:
- the logical stop location (below a bullish FVG if it should hold)
- where the idea breaks (if price fully trades through and closes beyond the zone)
- whether a pullback is normal (into the zone) or dangerous (through it)
The main advantage:
FVG zones turn market behavior into structured planning.
Confirmation: how to avoid treating FVG like a magic level
The biggest difference between consistently profitable and consistently frustrated traders is confirmation.
If you treat FVG as a magic level:
- you enter instantly on touch
- you get chopped up in ranges
- you suffer during volatile news spikes
- you mistake random noise for “reaction”
A better approach:
Use the FVG as the area, then use a trigger for timing.
Common confirmation triggers:
- Candle close confirmation: price enters the zone then closes back above (bullish) or back below (bearish)
- Reclaim: price dips into the zone then reclaims a key micro-level inside it
- Structure shift: lower timeframe makes a break of structure in your direction
- Momentum filter: RSI/EMA alignment improves as price leaves the zone
- Volatility filter: ATR is not exploding against you (huge volatility can invalidate)
You do not need all triggers.
But you should have at least one that answers:
“Is the market actually responding to this zone, or am I just hoping?”
Common mistakes and how to fix them
Mistake 1: Trading FVG against the dominant trend
A bullish FVG inside a strong downtrend often fails because sellers still control structure. Fix: trade with trend unless structure clearly shifts.
Mistake 2: Marking every tiny gap
Lower timeframes generate many small inefficiencies. Fix: prioritize clean displacement and higher timeframe zones.
Mistake 3: No invalidation rule
If you don’t define where you’re wrong, you hold losers too long. Fix: decide what “breaks the zone” (close through, full fill + continuation, or structure break).
Mistake 4: Ignoring volatility regime
During news spikes, price can blast through zones. Fix: use ATR/volatility context; avoid entering when volatility is expanding violently against you.
Mistake 5: Assuming fills are guaranteed
Some gaps remain open for a long time. Fix: treat fills as probabilities; use them as planning zones and targets, not certainty.
Best practices checklist
Use this checklist to keep FVG usage consistent:
- Start with structure: trend direction and key swing levels first
- Prefer clean displacement: not small random gaps
- Prioritize higher timeframe zones: daily/4H > 5m
- Treat FVG as a zone: not a single price line
- Expect partial fills: especially in strong trends
- Require confirmation: reclaim / close / structure shift
- Define invalidation: decide what proves you wrong
- Respect volatility: avoid entries during violent expansion against you
If you do these consistently, FVG becomes a high-quality planning tool rather than a random concept.
FVGs Are Zones, Not Lines
A Fair Value Gap is a range - the full three-candle gap between the high of the first candle and the low of the third. Price does not have to retrace to an exact point. Partial fills are common in strong trends, and treating the entire zone as relevant rather than hunting a single price level produces more consistent application of the concept.
Displacement Is What Makes the Zone Meaningful
Not every three-candle gap is worth trading. The FVG becomes significant when it was created by a displacement move - a strong, impulsive candle that broke structure, swept liquidity, or created a clear auction imbalance. A small random gap with no structural consequence is just price movement, not an inefficiency worth waiting for.
Define Invalidation Before You Wait
Know before price reaches the FVG what would prove the setup wrong. Common invalidation levels are a clean close through the zone without reaction, or a structural break in the opposite direction. Having that level defined means you can enter on reaction with confidence rather than second-guessing whether the zone is "still active" when price arrives.
Quick FAQ
Do Fair Value Gaps always fill?
No. Many fill partially or fully, but strong trends can continue without perfect fills. Treat them as zones, not guarantees.
Are FVGs the same as supply and demand zones?
They are related. Supply/demand zones describe where participants are likely active. FVGs describe where trading was skipped and may later rebalance.
What timeframe is best for FVGs?
Higher timeframes like daily and weekly produce more meaningful zones. Lower timeframes are best used for entry timing inside higher timeframe zones.
How should I confirm an FVG entry?
Common triggers include a close back above/below the zone, reclaim of a micro-level, or a lower timeframe structure break aligned with trend.
Why do FVGs sometimes fail completely?
They fail when the broader market regime changes (trend breaks), volatility spikes, or the zone was not meaningful liquidity in the first place.
DailyIQ publishes market education, score methodology, and research workflows to help users understand what the platform is measuring. Content is for informational purposes only and is not investment advice or a recommendation to buy or sell any security.
Use education with process, not in isolation
See how DailyIQ combines technical indicators, news sentiment, freshness checks, and editorial review to decide what gets surfaced and indexed.
Learn About Investing
These resources can help investors evaluate momentum, volatility, and trend strength when analyzing Fair Value Gaps, Imbalances, and Supply Demand Inefficiencies Explained.
 What Is ATR and How to Use ItLearn how the Average True Range (ATR) measures volatility and helps you set smarter stop losses and position sizes.Volatility · 16 min read
 What Is EMA and How to Read ItLearn how the Exponential Moving Average helps you identify trend direction, momentum shifts, and dynamic support or resistance.Technical · 16 min read
 What Are Heikin Ashi Candles and How to Read ThemLearn how Heikin Ashi candles smooth price action to help you identify trend strength, momentum shifts, and cleaner entries.Technical · 6 min read