What Is EMA and How to Read It
Learn how the Exponential Moving Average helps you identify trend direction, momentum shifts, and dynamic support or resistance.
Introduction To What Is EMA and How to Read It
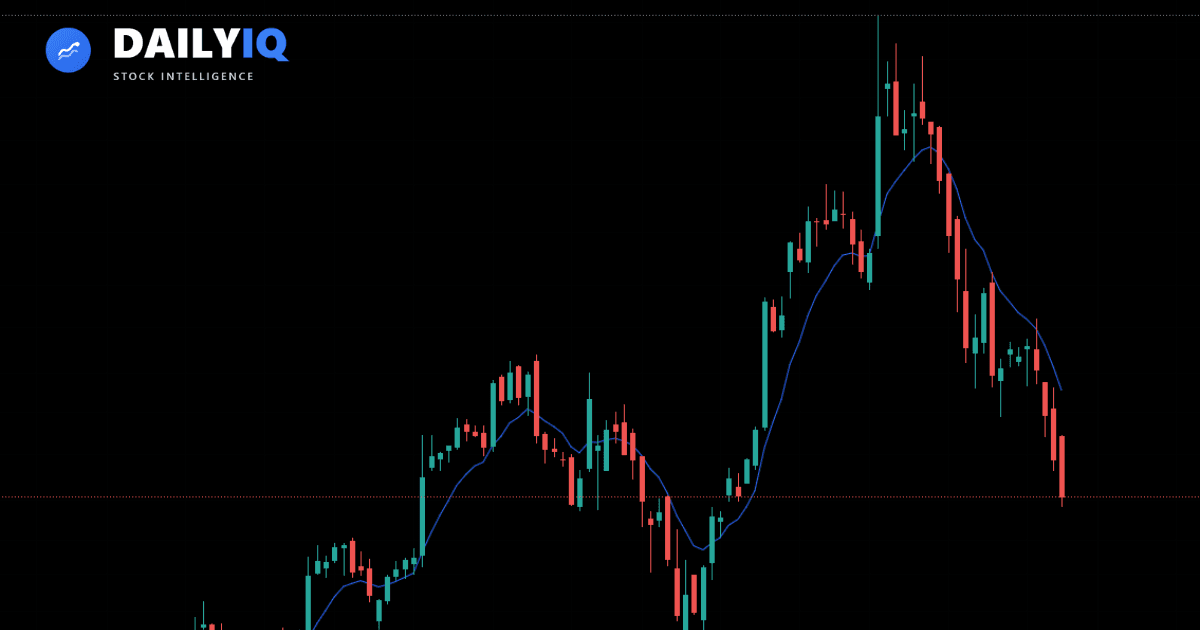
The EMA is one of the most practical tools for reading trend direction. It reacts faster than a simple moving average and often acts as a dynamic level where trends breathe before continuing.
The Exponential Moving Average (EMA) is one of the most widely used trend indicators in technical analysis. It helps traders identify the direction of a trend and determine whether momentum is strengthening or weakening.
Unlike price itself, which can be noisy and volatile, the EMA smooths price data to reveal the underlying trend. What makes EMA different from other moving averages is that it gives more weight to recent prices. This makes it more responsive to new market information.
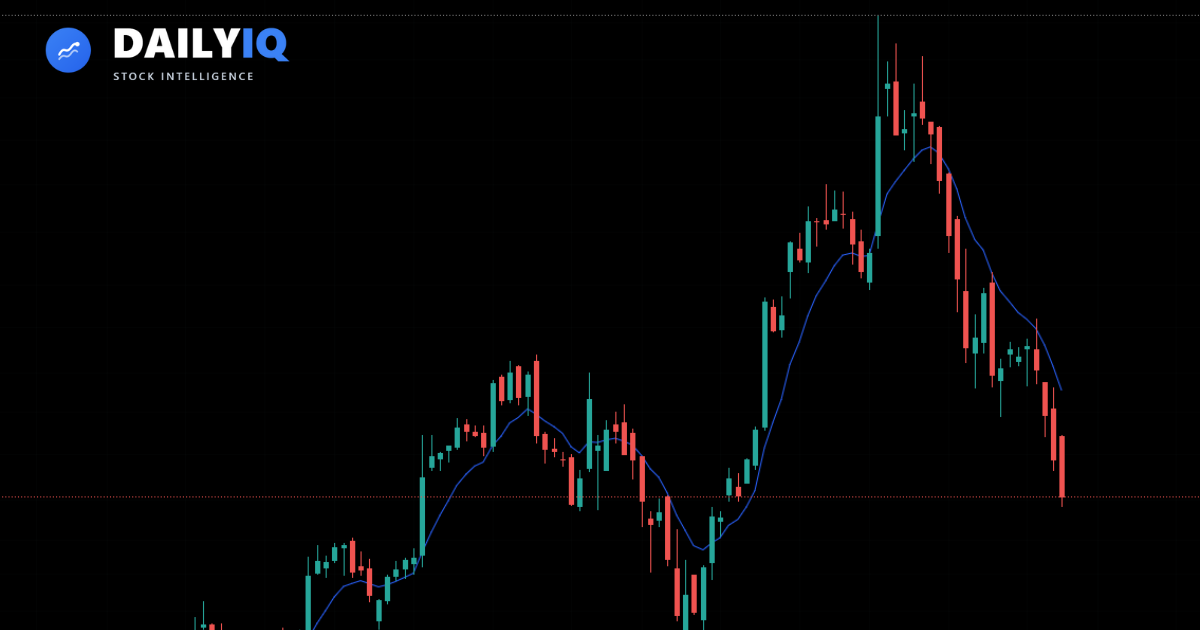
When price accelerates upward, the EMA rises faster.
When price falls sharply, the EMA turns downward more quickly.
The EMA helps answer a key question:
Is price trending, consolidating, or beginning to shift direction?
The EMA does not predict the future. Instead, it provides structure - helping traders align with trends rather than trade against them.
How EMA works
The Exponential Moving Average is calculated using a smoothing formula that emphasizes recent price action.
The formula is:
EMA = (Current Price × Multiplier) + (Previous EMA × (1 - Multiplier))
Where:
Multiplier = 2 / (Period + 1)
For example:
- A 9-period EMA reacts quickly to short-term price changes.
- A 21-period EMA reflects short-to-medium momentum.
- A 50-period EMA tracks intermediate trends.
- A 200-period EMA reflects long-term market structure.
Because recent prices receive more weight, the EMA adjusts faster than a Simple Moving Average (SMA).
Shorter EMAs move quickly and react to minor shifts.
Longer EMAs move slowly and filter out noise.
This balance allows traders to select EMAs based on their timeframe and strategy.
Reading EMA signals
EMAs are typically used in three main ways: trend identification, dynamic support and resistance, and crossover signals.
Trend direction
The most basic use of EMA is identifying trend direction.
In an uptrend:
- Price remains above the EMA.
- The EMA slopes upward.
In a downtrend:
- Price remains below the EMA.
- The EMA slopes downward.
In consolidation:
- Price moves back and forth across the EMA.
- The EMA flattens.
The slope of the EMA matters just as much as price location:
- Rising EMA → bullish momentum
- Falling EMA → bearish momentum
- Flat EMA → range-bound conditions
Dynamic support and resistance
EMAs often act as dynamic support or resistance.
In strong uptrends:
- Price may pull back toward the EMA.
- The EMA acts as a moving support level.
- Buyers often step in near the EMA.
In strong downtrends:
- Price may rally toward the EMA.
- The EMA acts as dynamic resistance.
- Sellers may defend that area.
Unlike horizontal levels, EMAs adjust over time as price evolves.
This makes them particularly useful in trending markets.
EMA crossovers
A common approach uses two EMAs - one short-term and one longer-term.
For example:
- 9 EMA (fast)
- 21 EMA (slow)
When the short EMA crosses above the longer EMA:
- This is called a bullish crossover.
- It may signal strengthening upside momentum.
When the short EMA crosses below the longer EMA:
- This is called a bearish crossover.
- It may signal strengthening downside momentum.
However, crossovers can produce false signals in choppy markets. They tend to work best in sustained trends.
EMA in trending vs ranging markets
EMA behaves differently depending on market structure.
In strong trending markets:
- EMA often provides clean pullback entries.
- Price respects the EMA as dynamic support or resistance.
- Crossovers can confirm trend continuation.
In range-bound markets:
- Price frequently crosses above and below the EMA.
- Crossovers may generate false signals.
- The EMA flattens and loses directional value.
Understanding whether a market is trending or ranging helps determine how reliable EMA signals may be.
EMA vs SMA
Both EMA and SMA smooth price, but they differ in responsiveness.
Simple Moving Average (SMA):
- Gives equal weight to all periods.
- Slower to respond to price changes.
- Often smoother and more stable.
Exponential Moving Average (EMA):
- Gives more weight to recent price.
- Responds faster to changes.
- Better suited for active traders.
Traders often prefer EMA when they want quicker reaction to momentum shifts.
Using multiple EMAs
Many traders stack multiple EMAs to analyze trend strength.
For example:
- 9 EMA (short-term momentum)
- 21 EMA (intermediate momentum)
- 50 EMA (trend structure)
- 200 EMA (long-term bias)
When shorter EMAs are above longer EMAs and all slope upward:
- Trend alignment is strong.
When shorter EMAs cross below longer EMAs:
- Momentum may be weakening.
EMA alignment can provide structure beyond a single line.
EMA and momentum shifts
EMA slope change is one of the quieter but more useful signals the indicator provides. When a steeply rising EMA begins to flatten, it does not mean price is reversing - it means the rate of upward acceleration is slowing. That deceleration often shows up in the EMA before it becomes visible in price itself.
A flat EMA after a strong trend is a reason to move from continuation bias to neutral. It means the trend is resting rather than continuing, and entries taken against a flat EMA in the same direction as the prior trend carry meaningfully less probability. When the EMA begins turning the other direction, the structural case for trend continuation has weakened and confirmation from price and volume becomes essential before adding exposure.
How DailyIQ uses EMA
DailyIQ uses EMA as a structural backbone within its Technical Score - not as a crossover trigger, but as a baseline for reading trend direction and momentum quality. Whether price is consistently above or below key EMAs, and whether those EMAs are sloping in the same direction, sets the context for every other signal in the system.
Multi-EMA alignment is given meaningful weight. When the 9, 21, and 50 EMAs are all sloping upward and price is above all three, trend alignment is clean and other bullish signals are more credible. When EMAs are compressing or crossing each other, the system treats it as a lower-conviction environment where individual signals carry less weight regardless of what they show.
Practical takeaways
EMA is a lagging indicator by design - it follows price, not the other way around. Its value is in clarifying direction and smoothing out noise, not in predicting what happens next. The moment you treat an EMA cross as a prediction instead of a description, you are asking it to do something it was not built for.
The most practical habit is to check EMA slope and alignment before evaluating any signal. A bullish crossover from a momentum indicator that happens while the EMA is still falling carries less weight than the same signal while the EMA is rising. Context changes everything, and EMA gives you that context quickly and cleanly.
EMA vs SMA: why exponential weighting matters
The mathematical difference between an Exponential Moving Average and a Simple Moving Average is how they weight each data point in the lookback window. A 20-period SMA gives identical weight to every price over the past 20 bars — today's price matters exactly as much as the price from 20 days ago. A 20-period EMA applies a smoothing multiplier that gives progressively more weight to recent prices, with the most recent close receiving the highest weight.
For a 20-period EMA, the smoothing multiplier is 2/(20+1) ≈ 9.5%. This means today's closing price contributes approximately 9.5% to the EMA value, yesterday's price contributes 9.5% of the remaining 90.5%, and so on. The result is a moving average that reacts noticeably faster to recent price changes than an SMA of the same period.
When EMA is preferable
EMA is generally preferable when you want the moving average to respond quickly to a change in trend direction. For active traders identifying momentum shifts, EMA catches turns faster than SMA with the same period setting, potentially providing earlier entry signals. For this reason, EMA is the foundation of MACD — the difference between two EMAs captures momentum shifts more quickly than a difference between two SMAs would.
When SMA is preferable
SMA is preferred when smoothness and stability are more important than responsiveness. Many institutional investors and long-term traders use the 200-day SMA as a major trend benchmark precisely because its stability makes it a more reliable level for support and resistance decisions. Choppy short-term price action disturbs the EMA more than the SMA, which can reduce the SMA's tendency to generate false crossover signals in range-bound conditions.
The practical takeaway: use EMA for active trend-following and momentum work, and SMA for longer-term trend benchmarking and when you want a cleaner moving average that is less prone to whipsaw.
Key EMA lengths and their meaning
Different EMA periods carry different practical significance in the market, partly because they correspond to logical calendar intervals and partly because they are watched by so many participants that they become self-reinforcing support and resistance levels.
8 EMA: Very short-term momentum
The 8-period EMA on a daily chart covers approximately 1.5 weeks of price action. It reacts very quickly to price changes and is primarily useful for identifying very short-term momentum and for trailing stops in fast-moving trends. When price consistently stays above the 8 EMA during a strong uptrend, that is a sign of momentum health. When price drops below the 8 EMA with conviction, it is often the first warning that short-term momentum is shifting.
21 EMA: Swing trading anchor
The 21-period EMA is one of the most widely used EMAs for swing traders. It corresponds approximately to one calendar month of trading days and captures intermediate-term momentum well. In strong uptrends, pullbacks to the 21 EMA that find buyers are a classic continuation setup. A sustained break below the 21 EMA on increasing volume signals that the swing-level momentum has shifted.
50 EMA: Medium-term trend gauge
The 50-period EMA represents approximately 2.5 months of trading and is one of the key medium-term trend lines. A stock trading above a rising 50 EMA has broadly positive intermediate-term trend momentum. Many institutional traders use the 50-day MA as a key decision level — adding to positions when price holds above it and reducing exposure on sustained breaks below.
200 EMA: The long-term regime line
The 200-period EMA is the most watched long-term trend indicator for daily charts. A stock trading above its 200 EMA is generally considered in a long-term uptrend; below it, a long-term downtrend. Many institutional investors use the 200-day line as a basic asset allocation guide — owning more equities when broad market indexes are above their 200 EMAs and being more defensive when they are below. The 200 EMA rarely changes quickly, making it a stable long-term reference level.
EMA as dynamic support and resistance
One of the most practical applications of EMAs is as dynamic support and resistance — moving levels that adjust as price evolves rather than staying fixed at a historical price point.
How pullbacks to EMAs work
In a strong uptrend, price does not move straight up. It advances, pauses or pulls back, then advances again. The EMA acts as a magnet during these pullbacks because many traders and algorithms are watching for price to return to the moving average as an opportunity to buy into the trend at a better price.
The 21 EMA test is one of the most common trade setups in active markets. A stock that has been trending upward with price consistently above the 21 EMA will often pull back to the 21 EMA level, hold it (often with a candlestick reversal pattern or increased buy volume), and then resume the uptrend. This setup is powerful because it provides a clear entry level (near the EMA) and a clear invalidation level (a sustained close below the EMA).
Treating EMA as a zone, not a line
When using EMAs as support or resistance, it is important to treat them as zones rather than exact prices. In fast-moving markets, price can briefly pierce the EMA by a small amount before recovering — this is normal. A brief intraday dip below the 21 EMA that closes back above it is very different from a daily close well below it on expanding volume.
EMA as resistance in downtrends
The same dynamic operates in downtrends but in reverse. During a downtrend, rallies toward a declining EMA are often sold. Sellers who are short the stock add to positions at the EMA; holders who bought at higher prices use the bounce to reduce their positions. The declining EMA acts as a ceiling that repeatedly caps upside attempts until the trend reverses with sufficient volume and conviction to break decisively above it.
Golden cross and death cross
The golden cross and death cross are two of the most widely discussed moving average crossover patterns in market commentary. Understanding what they actually mean — and what their limitations are — helps you use them appropriately.
Golden cross: 50 EMA crossing above 200 EMA
A golden cross occurs when the shorter-term 50-period EMA crosses above the longer-term 200-period EMA. Traditionally interpreted as a major bullish signal, it suggests that intermediate-term momentum has surpassed the long-term trend, and is often cited as a potential buy signal by financial media.
The reality is more nuanced. By the time a golden cross forms on a daily chart, the stock has typically already advanced substantially from the bottom that prompted the recovery — the 50 EMA takes many weeks to cross the 200 EMA after a bottom. Entering aggressively at the golden cross often means buying near a short-term overbought condition after a major run.
More experienced traders use the golden cross as a regime confirmation rather than a direct entry signal. It confirms that the trend structure has broadly shifted from bearish to bullish, which means subsequent bullish signals on lower timeframes (daily RSI recovery, MACD crossover) are more credible than they would have been before the cross.
Death cross: 50 EMA crossing below 200 EMA
A death cross occurs when the 50-period EMA crosses below the 200-period EMA. It represents the inverse of the golden cross — intermediate momentum has fallen below the long-term trend, broadly confirming a bearish regime. Like the golden cross, the death cross typically occurs well into a decline rather than at its beginning.
Both crosses are lagging indicators by design — they confirm trend changes that have already occurred rather than predicting them. Their value is in regime identification, not in precise timing.
EMA ribbon: reading trend health from multiple EMAs
The EMA ribbon is an advanced technique that stacks multiple EMAs — typically 5 to 8 EMAs with successive periods — on the same chart to visualize the health and strength of the current trend at a glance.
What a healthy uptrend looks like on the ribbon
In a strong, established uptrend, all EMA lines slope upward and are arranged in order from shortest period (fastest, closest to price) on top to longest period (slowest, farthest from price) on the bottom. The spacing between the EMAs is meaningful: wide spacing between the EMAs indicates strong momentum — the short-term EMA is pulling well ahead of the longer-term average. Tight spacing or compression indicates that momentum is fading or the trend is maturing.
What a weakening trend looks like
As a trend weakens, the shortest EMAs begin to flatten or turn down first, while the longer EMAs are still rising. This causes the ribbon to compress — the gap between fast and slow EMAs narrows. This compression is often the first visible sign that a trend is losing momentum before price itself shows any clear reversal.
When the shorter EMAs actually cross below the longer ones, the ribbon 'flips,' and the structure that was previously ordered with shorter EMAs on top is now inverted, signaling that the trend has shifted from bullish to bearish.
Common ribbon EMA sets
A simple ribbon can be built with just three EMAs (8, 21, 50) and provides clear visual information about short, intermediate, and medium-term trend alignment. A more detailed ribbon might use 5, 8, 13, 21, 34, 55 — Fibonacci-based periods that some traders prefer for their mathematical properties.
The key insight the ribbon provides is at a glance: when all EMAs are rising and fanned out upward, the trend is strong and consistent; when they are converging or crossing, the trend is in transition.
Slope Matters More Than Crossovers
A rising EMA with price consistently above it tells you more about trend health than an isolated crossover. EMA slope shows whether momentum is building, fading, or flat - and flat EMAs in choppy conditions are a signal to reduce trade activity, not increase it.
Use EMA as a Dynamic Level, Not a Line
Strong trends often pull back toward the EMA before resuming. Rather than waiting for price to hit the exact EMA value, treat it as a zone. Reactions a few points above or below the line are normal in volatile markets - precision is less important than direction.
Stack EMAs to Read Trend Strength
When the 9 EMA is above the 21, which is above the 50, all sloping upward together, trend alignment is strong. When they begin crossing or compressing, structure is weakening. Multiple EMAs moving in sync provide more conviction than any single line alone.
Quick FAQ
Which EMA lengths should I start with?
A common starting set is 9/21 for short-term momentum, 50 for trend structure, and 200 for long-term bias. Adjust only if your timeframe requires it.
Are EMA crossovers enough to trade on their own?
Usually no. Crossovers lag and can whipsaw in ranges. Confirm with price structure, market context, and risk-to-reward.
How do EMAs act as support or resistance?
In trends, pullbacks and rallies often react around key EMAs because many participants watch them. Treat them as dynamic zones, not exact lines.
How can I filter bad EMA signals in choppy markets?
Avoid low-slope, overlapping EMA conditions and require confirmation from higher timeframe trend or breakout structure.
What matters more: EMA slope or price crossing it?
Slope usually matters more for regime context. A rising EMA with price above it is stronger evidence than isolated crosses.
DailyIQ publishes market education, score methodology, and research workflows to help users understand what the platform is measuring. Content is for informational purposes only and is not investment advice or a recommendation to buy or sell any security.
Use education with process, not in isolation
See how DailyIQ combines technical indicators, news sentiment, freshness checks, and editorial review to decide what gets surfaced and indexed.
Learn About Investing
These resources can help investors evaluate momentum, volatility, and trend strength when analyzing What Is EMA and How to Read It.
 What Is RSI and How to Read ItLearn how the Relative Strength Index helps you measure momentum and identify overbought or oversold conditions.Technical · 16 min read
 What Is ATR and How to Use ItLearn how the Average True Range (ATR) measures volatility and helps you set smarter stop losses and position sizes.Volatility · 16 min read
 What Are Heikin Ashi Candles and How to Read ThemLearn how Heikin Ashi candles smooth price action to help you identify trend strength, momentum shifts, and cleaner entries.Technical · 6 min read
 Advanced Chart Analysis: Scaling, Volume, and Comparative Charting ExplainedA comprehensive guide to advanced chart construction including arithmetic vs logarithmic scales, dual y-axes, multi-line comparisons, and volume-based charting techniques.Technical · 22 min read
 Dow Theory History, Theorems, Trends, Confirmation, Volume & CriticismsA comprehensive and original deep dive into Dow Theory, including its historical roots, core theorems, trend classifications, confirmation principles, volume interpretation, criticisms, and modern relevance.Technical · 24 min read