Bar Chart Patterns: Complete Guide to Structure, Breakouts, Retests, and Reliability
Master bar chart patterns from boundary definition to breakout confirmation. Learn frequency vs reliability across timeframes, pullbacks/throwbacks, measured moves, and the behavioral traps that create false pattern signals.

Introduction To Bar Chart Patterns: Institutional Structure and Breakout Framework
Bar chart patterns are not predictions.
They are structure maps.
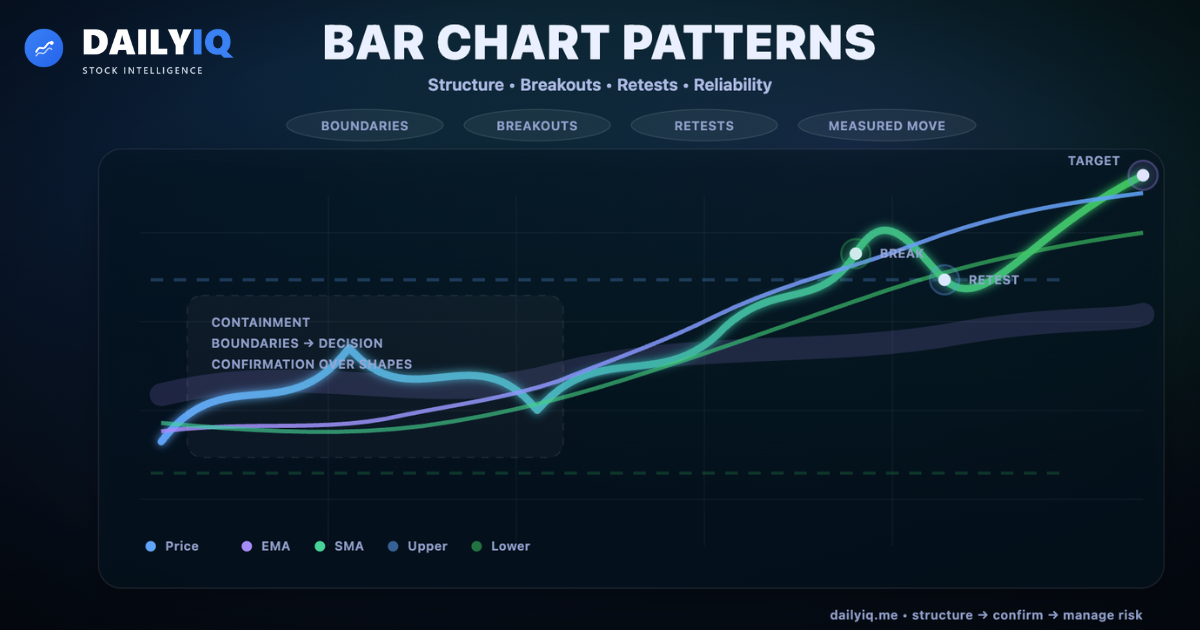
They show where price has been contained, where pressure has built, and where directional expansion becomes possible.
A pattern becomes tradable only when four things are clear:
- The boundary above and below price
- The breakout level that would invalidate containment
- The post-break behavior (follow-through or failure)
- The risk point where the setup is proven wrong
This is why professionals treat patterns as evidence frameworks, not visual stories. A recognizable shape has no value unless it gives clear decision points.
This guide covers:
- What a pattern actually means in technical terms
- Why short-term patterns appear more often but fail more often
- Breakout quality and confirmation logic
- Pullbacks and throwbacks as retest behavior
- Double tops/bottoms, rectangles, and triangle structures
- Triple tops/bottoms, wedges, diamonds, and broadening patterns
- Rounded bottoms, cup-and-handle, and head-and-shoulders transitions
- Flags and pennants as continuation pauses
- Measured move targets and their limitations
- Behavioral biases that create false pattern confidence
- How to systematize pattern work so it can be tested
Patterns do not create certainty.
They create decision structure.
What a Pattern Really Is: Bounded Price Action With a Decision Point
A pattern is a bounded configuration of price movement. The boundaries can be flat, sloped, or curved, but they must be clear enough that market participants can identify where containment ends.
That clarity matters because the boundary defines the decision point. If price exits the structure with conviction, behavior has changed from rotation to expansion.
The practical test is simple:
- Can you define the top and bottom boundary objectively?
- Can you define where breakout is confirmed?
- Can you define where the setup fails?
If not, the structure is visual noise, not a tradable pattern.
Professionals trade the transition.
Containment to expansion is the signal.
Frequency vs Reliability: Why Time Horizon Changes Pattern Quality
Shorter patterns form more often because small windows contain more random oscillation. More formations means more opportunities, but it also means more false breaks and failed follow-through.
Longer patterns form less often. They need more time for repeated boundary tests, which tends to improve structural clarity and risk definition.
This does not mean long equals guaranteed. It means the setup usually has stronger geometry and more meaningful invalidation levels.
A practical framework:
- Short horizon: demand stronger breakout confirmation
- Long horizon: prioritize structure quality and context alignment
Pattern frequency is not edge.
Pattern quality is edge.
Pattern Anatomy: Formation, Breakout, Retest, and Follow-Through
Most tradable patterns follow a sequence:
- Pre-pattern context (trend, pause, or balance)
- Structure formation within boundaries
- Breakout through the boundary
- Post-break behavior: continuation or failure
Retests are common. After a break, price may return to the broken level before continuing. This does not invalidate the breakout by default. It often tests whether former resistance can become support, or former support can become resistance.
Treat retests as information, not annoyance.
They help classify whether the break was accepted.
Breakout Quality: Not Every Boundary Violation Is a Signal
A breakout is actionable when behavior changes, not when price barely pokes through a line.
Stronger breakouts usually show:
- Clear pre-break boundaries
- Decisive break distance through the level
- Participation increase (range or volume expansion)
- Limited immediate re-entry into the pattern
Weaker breakouts often show:
- Ambiguous boundaries
- Tiny overshoots without expansion
- Immediate snapback inside structure
- No directional persistence
The goal is not to predict every break.
It is to avoid low-quality breaks.
Pullbacks and Throwbacks: The Retest Framework After Breakout
After an upside breakout, price sometimes revisits the broken resistance level. That retest is called a throwback.
After a downside breakout, price can revisit the broken support level. That retest is called a pullback.
Retests can improve entry quality because they offer a clearer invalidation point. But waiting for a retest can also miss strong moves that never come back.
This is a trade-off between price quality and participation certainty.
Use retests as a conditional second chance, not a mandatory rule.
Double Tops and Double Bottoms: Repeated Rejection and Level Failure
Double structures represent repeated tests of a key zone.
- Double top: repeated failure near resistance, then neckline/support break
- Double bottom: repeated defense near support, then neckline/resistance break
The pattern itself is not the trade. The breakout through the neckline is the decision event.
Confirmation rules usually include a decisive close beyond the neckline and evidence of continuation.
Without confirmation, these are just failed tests inside a range.
Rectangles and Ranges: Compression, Rotation, and Breakout Transition
Rectangles represent temporary equilibrium where buyers and sellers repeatedly rotate between the same boundaries.
During the range, directional edge is limited. The information value rises when price finally escapes the box with expansion and acceptance.
Range logic:
- Inside the box: mean-reversion behavior dominates
- Outside the box: trend behavior can emerge
This is why rectangles are popular in both discretionary and systematic trading frameworks. The boundaries are explicit and testable.
Triangles: Compression Patterns and Directional Resolution
Triangles reflect narrowing price swings and decreasing space between support and resistance.
Common forms:
- Ascending triangle: flat resistance + rising support
- Descending triangle: falling resistance + flat support
- Symmetrical triangle: both boundaries converge
The convergence itself is not direction. Direction is decided by the breakout and subsequent acceptance outside the boundary.
Even directional triangle labels are probabilities, not laws. A descending triangle can break upward when sellers lose control and buyers absorb supply aggressively near support.
Compression is setup.
Resolution is confirmation.
Triple Tops and Triple Bottoms: Repeated Defense, Exhaustion, and Neckline Resolution
Triple tops and triple bottoms extend double-pattern logic: repeated tests of a zone with diminishing ability to push beyond it.
Rule discipline:
- The three tests should occur near a clearly identifiable level
- The middle valleys/peaks should be meaningful, not micro-noise
- Confirmation comes from neckline break and acceptance, not from the third touch alone
Triple formations are useful because they expose exhaustion. They are also easy to over-label, which is why strict boundary definition is mandatory.
Wedges, Diamonds, and Broadening Patterns: Expansion/Contraction Regime Shifts
The original source content includes several advanced families beyond basic doubles and triangles:
- Rising wedge: upward drift with weakening momentum, often vulnerable to downside break
- Declining wedge: downward drift with fading selling pressure, often resolves up
- Diamond pattern/top: expansion followed by contraction, typically around major transitions
- Broadening pattern: widening swings and unstable participation, higher execution risk
These structures are about volatility regime shifts. They represent transitions between imbalance, uncertainty, and directional resolution.
Rounded Bottom, Cup-and-Handle, and Head-and-Shoulders Families
The source file also covers slower transition patterns:
- Rounded bottom (cup/bowl): gradual shift from distribution to accumulation
- Cup-and-handle: rounded recovery plus final consolidation before break
- Head and shoulders (top): three-peak exhaustion and neckline failure
- Inverse head and shoulders: three-trough reversal and neckline breakout
These setups matter because they map participant control shifts over longer windows. They often appear near important cycle transitions rather than short-term noise swings.
Flags and Pennants: Continuation Pauses Inside Strong Trends
Flags and pennants are continuation structures covered multiple times in the original source.
Core logic:
- Strong impulse move (flagpole)
- Tight pause where volatility contracts
- Breakout in direction of prior impulse
They are execution-friendly because boundaries are clear and invalidation is near the opposite side of consolidation.
Market Structure, Reliability, and Computer-Era Execution Reality
The original content repeatedly highlights that pattern results depend on execution conditions, not shape alone.
High reliability tends to occur when:
- The prior trend and formation type are aligned
- Boundaries are clean and tested multiple times
- Breakout shows decisive acceptance and persistence
Failure risk rises when:
- Market is sideways or low-conviction
- Pattern geometry is loose or forced
- Breakout re-enters structure quickly (false break)
Modern execution adds extra complexity: faster information flow, crowded pattern recognition, and index/derivative flows can distort clean textbook behavior. In practice, pattern edge comes from context filtering and risk control, not memorizing names.
Long-Term Pattern Behavior and Practical Application Framework
Long-duration patterns are usually more significant because they represent larger capital positioning cycles and slower supply-demand transitions.
From the original source material, the practical loop is:
- Define the structure while it is forming
- Confirm the breakout with objective rules
- Manage risk through invalidation and sizing
- Reassess if price re-enters old structure
Patterns are probabilistic frameworks. Their value is highest when they are integrated with trend context, volatility behavior, and disciplined execution.
Measured Move Targets: Useful Projection, Not a Guarantee
A common target method projects pattern height from the breakout point.
Example:
- Pattern height = distance from upper to lower boundary
- Project that distance in the breakout direction
This gives a structured expectation, not a certainty. Real markets may underperform or overshoot the projection depending on regime, volatility, and liquidity.
Measured moves are planning tools.
Risk control still decides outcomes.
Behavioral Risk: Pattern Recognition Bias and False Confidence
Humans are excellent at detecting shapes, even in randomness. That is helpful for exploration, but dangerous for trading decisions.
Common failure modes:
- Seeing patterns without clear boundaries
- Ignoring invalidation once emotionally committed
- Overweighting recent winning pattern examples
- Confusing visual familiarity with statistical edge
Pattern work must stay evidence-based:
- Define structure before breakout happens
- Define invalidation before entry
- Track outcomes across large samples
Without this discipline, patterns become stories.
With discipline, they become process.
Conclusion: Using Bar Chart Patterns as a Decision Framework
The objective of pattern analysis is not perfect prediction. It is repeatable decision quality.
High-quality pattern process:
- Start with objectively defined boundaries
- Wait for confirmed structural change
- Respect retests as information, not contradiction
- Use targets as planning tools, not promises
- Keep invalidation and sizing explicit
Pattern edge does not come from drawing lines.
It comes from applying the same decision rules with discipline over time.
Boundaries Must Be Clear Before Any Breakout Rule Applies
A pattern without well-defined boundaries is just chart noise. The upper and lower limits of a rectangle, the converging lines of a triangle, or the neckline of a reversal -- these must be clearly identifiable before any breakout rule is valid. If you cannot draw the boundaries with confidence, there is no pattern and no edge.
Behavior After the Break Matters More Than the Break Itself
The most important question after a breakout is whether price accepts the new level or gets rejected back. A candle that breaks, then closes below the level, is a failed breakout -- not a reason to hold. Genuine breakouts expand, hold the new level on pullbacks, and show volume pickup. One candle beyond the line is the start of confirmation, not the end of it.
Track Outcomes to Escape Pattern Bias
Humans are wired to remember the patterns that worked and forget the ones that failed. The only way to know whether a pattern actually has an edge is to track results consistently across many samples under the same rules. Without that record, you are trading on memory and confirmation bias rather than evidence.
Quick FAQ
Are short-term patterns always worse than long-term patterns?
Not always. Short-term setups can work, but they are usually noisier and need stricter confirmation and tighter execution discipline.
What is the difference between a pullback and a throwback?
A throwback retests a level after an upside breakout. A pullback retests a level after a downside breakout.
Do measured move targets reliably hit?
They are useful projection tools, not guarantees. Market regime and participation determine whether targets underperform or overshoot.
Can a descending triangle break upward?
Yes. Descending triangles are not direction guarantees. If sellers lose control and buyers absorb supply near support, upside resolution can occur.
How are wedges different from triangles?
In wedges, both boundaries slope in the same direction and converge. In triangles, boundaries usually oppose each other or include a flat side.
Why do textbook patterns fail more often in live markets?
Crowded positioning, derivatives/index flows, and fast execution can distort clean geometry. Context and confirmation are more important than label purity.
How can I reduce false breakout trades?
Demand clean boundaries, decisive break distance, acceptance outside structure, and explicit invalidation. Avoid trading ambiguous breaks.
What is the biggest mistake in pattern analysis?
Seeing what you want to see. Pattern work fails when visual bias replaces predefined rules and post-trade tracking.
DailyIQ publishes market education, score methodology, and research workflows to help users understand what the platform is measuring. Content is for informational purposes only and is not investment advice or a recommendation to buy or sell any security.
Use education with process, not in isolation
See how DailyIQ combines technical indicators, news sentiment, freshness checks, and editorial review to decide what gets surfaced and indexed.
Learn About Investing
These resources can help investors evaluate momentum, volatility, and trend strength when analyzing Bar Chart Patterns: Complete Guide to Structure, Breakouts, Retests, and Reliability.
 Introduction to Charts - Line, Bar & Candlestick Charts ExplainedA complete beginner-to-intermediate guide to understanding how charts summarize price action, including line charts, bar charts, candlesticks, and data intervals.Technical · 22 min read
 Trend Lines in Technical Analysis: The Complete Institutional GuideMaster trend lines, accelerating and decelerating structures, channels, log scale, Pitchfork, Gann fans, and professional breakout confirmation.Technical · 22 min read
 Breakouts, Stops & Retracements: The Institutional Trading FrameworkMaster breakout confirmation, volume analysis, volatility filters, ATR methods, pivot techniques, anticipation signals, and professional stop-loss management.Technical · 24 min read
 Moving Averages: Complete Guide to Trend Identification, Bands, Envelopes, and Breakout ChannelsMaster moving averages from core smoothing mechanics to advanced volatility tools. Learn SMA vs EMA, crossover signals, whipsaws, envelopes, Bollinger/Keltner/STARC bands, Donchian breakouts, and how institutions confirm trends and filter false signals.Technical · 58 min read
 Advanced Chart Analysis: Scaling, Volume, and Comparative Charting ExplainedA comprehensive guide to advanced chart construction including arithmetic vs logarithmic scales, dual y-axes, multi-line comparisons, and volume-based charting techniques.Technical · 22 min read