Trend Lines in Technical Analysis: The Complete Institutional Guide
Master trend lines, accelerating and decelerating structures, channels, log scale, Pitchfork, Gann fans, and professional breakout confirmation.

Introduction To Complete Guide To Trend Lines in Technical Analysis
Trend lines are the structural backbone of technical analysis.
Before oscillators, before moving averages, before geometric tools - there was structure. And structure begins with trend.
A properly drawn trend line does more than connect two points. It defines:
- Where demand consistently steps in
- Where supply repeatedly overwhelms price
- When momentum is accelerating
- When a trend is weakening
- When structural breakdown occurs
Most retail traders draw lines casually. Professionals treat them as dynamic representations of supply and demand equilibrium.
This guide consolidates everything:
- Arithmetic vs logarithmic scaling
- Accelerating and decelerating trends
- Fan lines
- Channel construction
- Internal trend lines
- Speed lines
- Andrew’s Pitchfork
- Gann fan geometry
- Breakout confirmation principles
- Structural best practices
Trend lines do not forecast the future.
They define the battlefield between buyers and sellers.
What a Trend Truly Represents (Supply, Demand & Structural Memory)
A trend is not just a visual slope. It is evidence of sustained imbalance.
In an uptrend, buyers consistently demonstrate willingness to pay progressively higher prices. Each pullback finds support at a higher level than before. This reflects increasing confidence and expanding demand.
In a downtrend, sellers dominate. Rallies fail at progressively lower levels. Supply consistently overwhelms attempts to move higher.
What makes trends powerful is structural memory. Market participants remember previous reaction levels:
- Buyers remember where price bounced.
- Sellers remember where price failed.
- Institutions remember accumulation zones.
- Retail traders remember regret levels.
When price approaches those prior zones again, behavior clusters. Trend lines connect these clustered behaviors into a visual representation of supply-demand consistency.
A trend line is therefore not arbitrary. It maps repeated psychological reactions.
When that line breaks decisively, it signals that the psychological equilibrium has changed.
Trend reversals are not mystical. They are simply structural shifts in participation.
Understanding this transforms trend lines from drawing tools into behavioral maps.
How to Draw Professional-Grade Trend Lines (Precision & Context)
Drawing effective trend lines requires discipline.
In an uptrend, you connect higher lows, not random intraday wicks. The goal is to capture consistent support behavior - not noise.
In a downtrend, you connect lower highs, identifying persistent supply zones.
Three important refinements improve quality:
-
Use closing prices when possible. Closing levels reflect institutional positioning and reduce false signals caused by intraday volatility.
-
Avoid forcing lines to fit. If price does not naturally align, the trend may not be clean.
-
Respect timeframe hierarchy. A weekly trend line carries more weight than a 5-minute line.
The more touches a trend line receives without breaking, the more structurally significant it becomes. However, steep lines tend to break faster because they represent aggressive, often emotional price acceleration.
Trend lines should not be constantly adjusted. They represent structure, not perfection.
A professional trend line is slightly imperfect - but structurally honest.
Arithmetic vs Logarithmic Charts (Why Scale Changes Everything)
Scale fundamentally changes interpretation.
On an arithmetic chart, equal vertical distance represents equal dollar movement. This works well for short-term charts where price fluctuations remain within moderate bounds.
However, over longer timeframes, investors think in percentages - not absolute points.
For example:
- A move from $10 to $20 is 100%.
- A move from $100 to $110 is 10%.
Arithmetic charts visually treat both as equal vertical distance - which distorts long-term structure.
Logarithmic charts correct this by spacing price moves according to percentage change. Over long horizons, this produces more accurate trend line slopes.
When price moves across large ranges (doubling, tripling, collapsing 50%), logarithmic scaling becomes essential.
Professionals often:
- Use arithmetic for short-term trading
- Use logarithmic for strategic analysis
Choosing the wrong scale can lead to misjudging slope, momentum, and structural breakpoints.
Scale is not cosmetic. It defines structural interpretation.
Accelerating Trend Lines (Momentum Expansion & Emotional Phases)
Markets rarely move at constant speed.
In speculative phases, trends accelerate. Price rises faster than the original slope. The initial trend line becomes too shallow to contain pullbacks.
A new, steeper line must be drawn.
This acceleration reflects:
- Increased participation
- Media attention
- Momentum chasing
- Short covering
- Emotional buying
However, acceleration contains a hidden warning.
If slope continues increasing, it eventually approaches vertical - an unsustainable condition. At that stage, any loss of momentum can trigger sharp reversal.
Acceleration is therefore a late-stage phenomenon.
It signals strength - but also fragility.
When analyzing accelerating trends:
- Monitor volume expansion
- Watch for exhaustion gaps
- Evaluate slope steepness
- Prepare for potential volatility spikes
The steeper the trend, the more cautious risk management must become.
Acceleration is momentum expansion - but it often precedes exhaustion.
Decelerating Trends & Fan Lines (Momentum Fatigue Before Reversal)
The opposite of acceleration is deceleration.
Sometimes a strong trend breaks its initial line - but does not immediately reverse. Instead, a flatter line replaces it. Later, that line breaks too. Another, even flatter line forms.
This produces a fan-like pattern.
Each successive break indicates weakening momentum.
Historically, many practitioners observe that after three fan line breaks, probability of full reversal increases significantly.
Why?
Because repeated structural adjustments show that buyers (in uptrends) or sellers (in downtrends) are losing consistency. Pullbacks deepen. Rallies shorten. Volatility increases.
Fan lines measure exhaustion in stages.
They show transition from:
Strong trend → weakening trend → unstable trend → potential reversal.
Fan patterns often accompany distribution or accumulation phases.
They do not guarantee reversal - but they signal structural fatigue.
When fan lines appear, tighten risk controls.
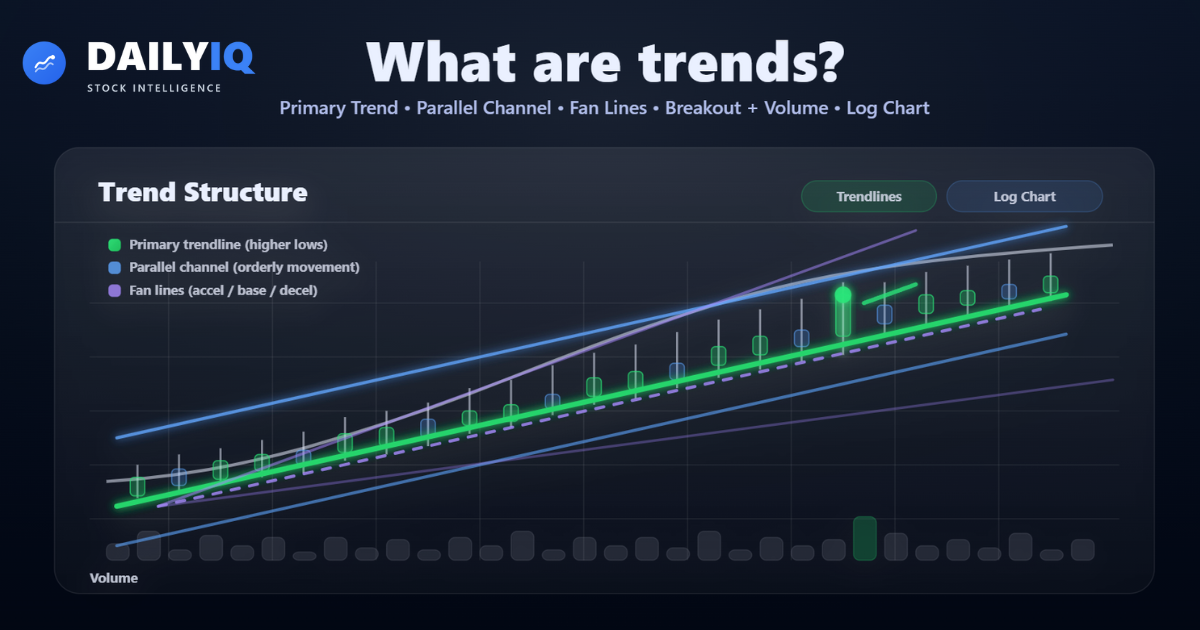
Channels (Parallel Structure & Trend Boundaries)
Channels expand the concept of trend lines by adding parallel boundaries.
In an uptrend:
- The lower line connects support troughs.
- A parallel line through peaks forms resistance.
Price often oscillates between these two boundaries.
Channels serve several purposes:
- Define expected pullback zones
- Identify potential profit targets
- Detect acceleration beyond normal structure
- Reveal weakening if price fails to reach upper boundary
When price breaks above a channel, acceleration may be occurring. But excessive acceleration often precedes correction.
When price breaks below a channel, structural weakness increases.
Channels reflect rhythm.
Healthy trends move within orderly channels. Disorder within channels signals instability.
Channels also allow traders to differentiate between:
- Minor pullback
- Structural breakdown
- Volatility expansion
Parallel geometry brings clarity to trend strength.
Never Anticipate Reversals (The Structural Discipline Rule)
One of the most important principles in trend analysis:
Never anticipate a reversal.
Acceleration may suggest a trend is near exhaustion. Divergence may appear. Volume may shift.
But until structure breaks, the trend remains intact.
Attempting to call tops or bottoms during rapid movement often leads to premature entries against dominant momentum.
Instead:
- Wait for decisive break of primary trend line
- Confirm with closing strength
- Observe follow-through behavior
- Look for failed retests
Reversals are confirmed by structural change - not intuition.
Patience is not weakness in trend trading.
It is discipline.
Internal Trend Lines (Midpoint Structure & Short-Term Context)
Internal trend lines run through the center of price action rather than connecting outer extremes.
They resemble regression lines or mid-channel structures.
These lines attempt to capture average trajectory rather than boundary support.
Internal lines can help:
- Identify internal pullback rhythm
- Assess short-term momentum
- Detect mid-trend structure shifts
However, they are more subjective and less powerful than outer boundary lines.
Because they do not define hard supply-demand reactions, their structural reliability is limited.
In many cases, moving averages perform similar midpoint analysis with less subjectivity.
Internal lines provide nuance - but should not override primary structure.
Speed Lines, Andrew's Pitchfork & Gann Fan Lines (Advanced Geometric Methods)
Several advanced geometric tools attempt to refine trend analysis.
Speed Lines
Speed lines divide a major price move into fractional retracement levels, often thirds. These levels act as potential support or resistance zones. Modern variations sometimes substitute Fibonacci ratios (38.2%, 61.8%).
While visually useful, retracement percentages are not consistently reliable across all markets.
Andrew’s Pitchfork
Constructed from three pivots, it draws a median line with parallel boundaries. The theory suggests price gravitates toward the median.
Although visually appealing, empirical consistency is mixed.
Gann Fan Lines
Based on geometric price/time relationships (1x1, 1x2, 2x1 angles), Gann fans assume proportional movement between price and time.
While historically influential, statistical evidence supporting predictive power is limited.
Across all variations, simple, clean trend lines remain the most reliable structural tool.
Complex geometry does not necessarily improve probability.
Breakout Confirmation & Structural Change
A meaningful trend line break requires confirmation.
Key confirmation factors:
- Strong closing price beyond line
- Volume expansion
- Follow-through sessions
- Failed retest of broken structure
False breakouts often show:
- Weak close
- Immediate reversal
- No volume confirmation
Breakouts represent supply-demand shifts.
Without confirmation, penetration may simply reflect volatility noise.
Structural change must prove itself.
How DailyIQ Integrates Trend Structure
DailyIQ uses trend lines as structural anchors inside its Technical Score framework.
Trend structure is evaluated alongside:
- EMA alignment
- Volume expansion
- Momentum indicators
- Volatility conditions
- Multi-timeframe context
Rather than issuing signals based on line penetration alone, DailyIQ weighs structural confirmation.
Structure defines bias. Indicators refine timing.
This layered approach reduces false signals and improves directional consistency.
Professional Best Practices
- Use log scale for long-term structure
- Draw clean lines through meaningful pivots
- Avoid constant adjustments
- Monitor slope changes carefully
- Treat acceleration with caution
- Confirm breaks with closing strength
- Never trade anticipation
- Combine structure with fixed risk rules
Trend lines define probability - not certainty.
Risk management defines survival.
Structure Over Perfection
A trend line does not need to touch every pivot to be valid -- it needs to capture the structural slope honestly. Forcing a line through every point usually produces a distorted picture. Draw through the most significant lows in an uptrend or highs in a downtrend, and accept that real markets are slightly messy. Constant redrawing to fit new data is a sign the trend is losing definition, not that your line was wrong.
Scale Determines What You See
Logarithmic scale shows percentage moves equally across the chart -- a move from $10 to $20 looks the same as $100 to $200 because both are 100%. Arithmetic scale shows absolute point moves, which can make early price action look flat and recent action look exaggerated on long-term charts. For anything spanning more than a few months, log scale almost always gives a more accurate structural picture.
Breaks Require Confirmation, Not Just a Touch
Price crossing a trend line intraday is not a break. A candle close beyond the line with follow-through over the next session or two is the minimum standard for a genuine structural break. Many of the most painful trading losses come from entering on a trend line touch that turned out to be a false break -- waiting for close and follow-through eliminates the majority of those.
Quick FAQ
How many touches make a trend line valid?
The more touches a trend line receives without breaking, the more structurally significant it becomes. However, two solid touches can establish structure. Quality of touches matters more than quantity.
What's the difference between a trend line break and a false breakout?
A true break is confirmed by strong closing strength, volume expansion, and follow-through sessions. False breakouts show weak closes, immediate reversals, and no volume confirmation. Always require confirmation.
Should I use arithmetic or logarithmic scale?
Use logarithmic for long-term analysis where percentage movements matter (weeks/months/years). Use arithmetic for short-term trading (days/hours). Mismatched scales distort trend slope interpretation.
What does it mean when a trend accelerates?
Acceleration (steepening slope) reflects increased participation and momentum. However, steeper trends become unsustainable and fragile. Acceleration is late-stage strength that often precedes exhaustion.
How do fan lines indicate weakening momentum?
When a trend breaks its initial line and a flatter line replaces it, then that breaks too, you have a fan pattern. Each successive break shows buyer/seller conviction fading. Three fan breaks often precede full reversals.
Can I use trend lines with moving averages?
Yes. Trend lines define structure, moving averages smooth momentum. Use trend lines for key support/resistance levels, moving averages for shorter-term directional bias. They complement each other.
DailyIQ publishes market education, score methodology, and research workflows to help users understand what the platform is measuring. Content is for informational purposes only and is not investment advice or a recommendation to buy or sell any security.
Use education with process, not in isolation
See how DailyIQ combines technical indicators, news sentiment, freshness checks, and editorial review to decide what gets surfaced and indexed.
Learn About Investing
These resources can help investors evaluate momentum, volatility, and trend strength when analyzing Trend Lines in Technical Analysis: The Complete Institutional Guide.
 The Basic Principle of Technical Analysis - The TrendUnderstand how trends form, why they matter, how they are identified, and the core assumptions technical analysts rely on when studying market price behavior.Technical · 12 min read
 Dow Theory History, Theorems, Trends, Confirmation, Volume & CriticismsA comprehensive and original deep dive into Dow Theory, including its historical roots, core theorems, trend classifications, confirmation principles, volume interpretation, criticisms, and modern relevance.Technical · 24 min read
 Introduction to Charts - Line, Bar & Candlestick Charts ExplainedA complete beginner-to-intermediate guide to understanding how charts summarize price action, including line charts, bar charts, candlesticks, and data intervals.Technical · 22 min read
 What Is EMA and How to Read ItLearn how the Exponential Moving Average helps you identify trend direction, momentum shifts, and dynamic support or resistance.Technical · 16 min read
 Advanced Chart Analysis: Scaling, Volume, and Comparative Charting ExplainedA comprehensive guide to advanced chart construction including arithmetic vs logarithmic scales, dual y-axes, multi-line comparisons, and volume-based charting techniques.Technical · 22 min read