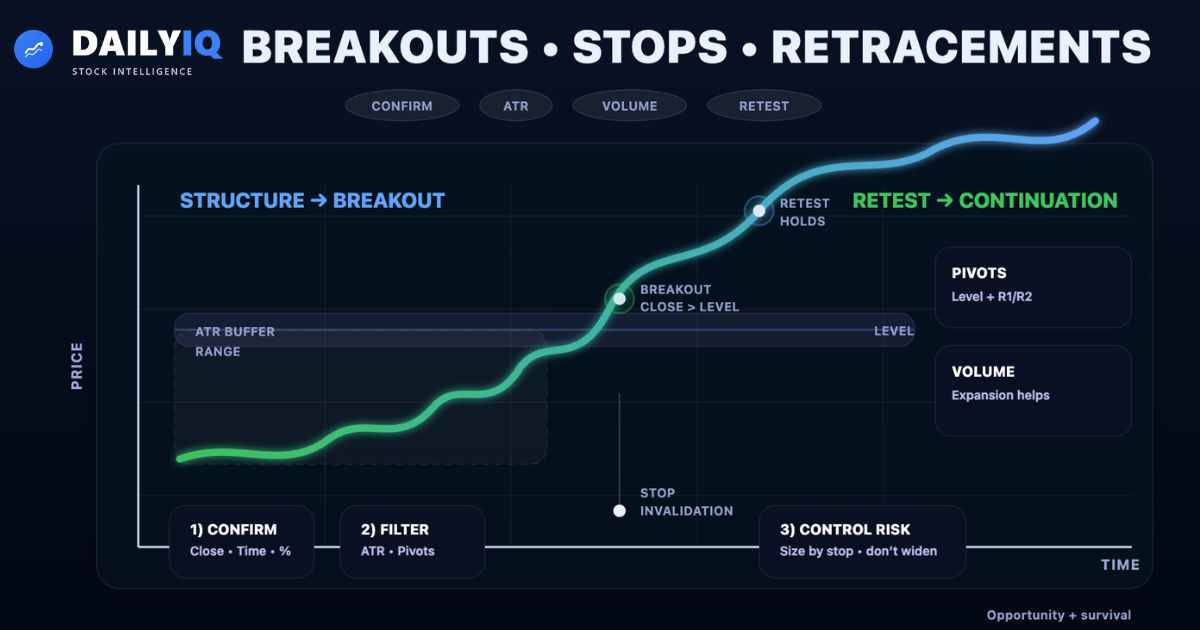
Breakouts, Stops & Retracements: The Institutional Trading Framework
Master breakout confirmation, volume analysis, volatility filters, ATR methods, pivot techniques, anticipation signals, and professional stop-loss management.

Introduction To Complete Guide to Breakouts, Stops & Retracements
Breakouts mark structural change.
When price escapes a well-defined support or resistance area, something meaningful has shifted in the supply–demand balance. But not every penetration is real. False moves are common. Emotional reactions are frequent. Whipsaws are expensive.
Professional trading is not about spotting breakouts first.
It is about confirming them properly and managing risk once involved.
This guide explains:
- What constitutes a valid breakout
- Close confirmation rules
- Percent and point filters
- Time-based confirmation
- Volume validation
- Volatility adjustments using ATR
- Pivot point confirmation methods
- Anticipating breakouts before they occur
- Entry and exit stop strategy
- Avoiding whipsaw damage
- Proper stop management discipline
Breakouts create opportunity.
Stops create survival.
What Is a Breakout? Structural Shift in Supply and Demand
A breakout occurs when price moves decisively beyond a previously established support or resistance level. These levels represent zones where supply and demand have repeatedly interacted. When price escapes one of these areas, it signals that prior equilibrium has changed.
In an uptrend continuation, a breakout above resistance confirms that buyers are willing to transact at increasingly higher prices. In a reversal, a breakout against the prior trend suggests that the dominant side has lost control.
However, not every price penetration constitutes a true breakout. Markets frequently push slightly beyond a level and then reverse. These false breakouts occur because liquidity clusters around obvious levels, stop orders are triggered, short-term traders overreact, and larger participants probe for order flow.
The exact level where a breakout is defined can also be ambiguous. Support and resistance often exist as zones rather than single price points, which is why professionals think in “areas” instead of one perfect line.
Because false signals are common, breakout trading always involves a trade-off between acting quickly and waiting for confirmation. Acting early may capture larger profits but increases the probability of being wrong. Waiting reduces false signals but sacrifices part of the move.
Breakouts are not merely price events. They are transitions in market control. Recognizing that shift correctly is what separates disciplined traders from reactive ones.
Close Confirmation Rule: Why the Closing Price Matters
 One of the most widely respected breakout confirmation methods is the closing price filter.
Intraday penetration is common. Price may briefly move beyond a resistance level during the session and then close back within the range. These intrabar moves frequently turn out to be false, especially when the level is obvious and order flow is crowded.
The close matters because it reflects final positioning, removes intraday noise, captures end-of-session conviction, and reduces emotional reaction to spikes. Even in markets that trade nearly 24 hours, “closing strength” still matters because many participants benchmark decisions around settlement behavior and end-of-session liquidity.
Under the close confirmation rule, a breakout is considered more reliable if price closes beyond the breakout level - not merely trades beyond it. Some traders require one confirmed close. Others require two consecutive closes beyond the level.
There is always a trade-off:
Faster entry → higher risk
Confirmed entry → lower risk, smaller reward
Close confirmation is particularly valuable in volatile markets where temporary spikes frequently occur. Professional breakout traders respect closing strength because it is one of the simplest and most powerful filters available.
Point and Percent Filters: The 1–3% Breakout Validation Rule
 Another confirmation technique uses a predefined distance beyond the breakout level.
Instead of requiring only a close, this method demands that price exceed the level by a specified number of points or percentage. A commonly referenced benchmark is a 1%–3% move beyond the breakout boundary.
The logic is straightforward: if price can move meaningfully beyond the level, the breakout is less likely to be accidental. Point and percent filters are particularly useful in systematic strategies where fixed thresholds must be defined in advance.
However, fixed filters have a limitation. They do not account for differences in volatility between assets. A 2% move in a slow utility stock may be meaningful. The same move in a volatile technology stock may be routine noise.
Despite this limitation, percent filters remain popular because they provide clarity and objectivity. They remove subjectivity from breakout decisions and reduce emotional bias.
The key principle is consistency. Once a filter is chosen, it must be applied uniformly rather than adjusted after the fact. Consistency builds statistical reliability.
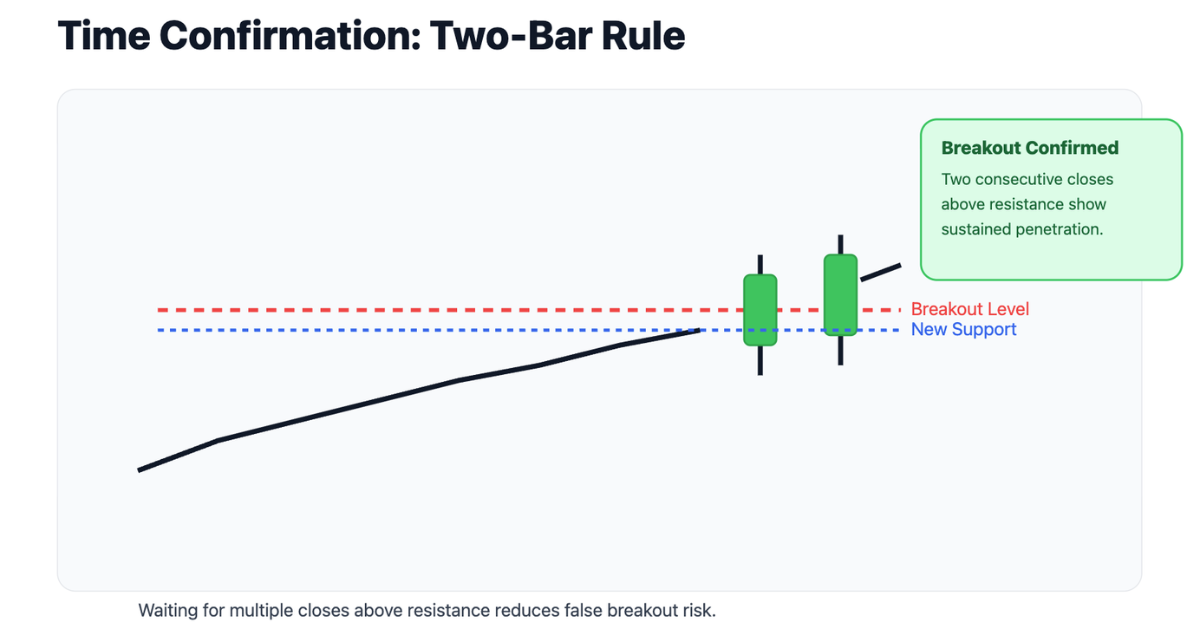
Time Confirmation: Two-Bar Rule and Sustained Penetration
 Time can serve as an additional validation tool.
Instead of focusing solely on distance, time-based confirmation evaluates how long price remains beyond the breakout zone. A common approach requires two consecutive closes beyond the breakout level or a defined number of bars holding outside the zone.
The reasoning is structural persistence. If price can sustain its position beyond resistance or support, it indicates that the supply–demand imbalance is not temporary. Brief penetration followed by immediate reversal often signals a false breakout. Sustained penetration suggests commitment.
Time filters are especially useful in sideways markets where volatility causes frequent temporary breaches. By combining close confirmation with time persistence, traders can significantly reduce false entries.
However, delay increases opportunity cost. The longer one waits, the more potential profit is sacrificed if the breakout continues strongly.
Time confirmation is about patience and probability - not perfection.
Volume as Breakout Confirmation: Participation Strength
 Volume measures participation.
A breakout accompanied by rising volume suggests that multiple market participants are acting in the direction of the move. This broad participation strengthens the probability that the breakout will sustain.
When price breaks resistance on light volume, skepticism is warranted. Low participation implies limited conviction. That said, volume confirmation is not absolute. Some valid breakouts can occur with average or declining volume, particularly in thinner markets, during holidays, or when participation is shifting across venues.
Generally, stronger volume during breakout implies institutional involvement, increased conviction, and expanding demand or supply imbalance. Conversely, declining volume during pullbacks within a range may signal that counter-pressure is weakening before an upside breakout.
Volume does not predict breakouts alone. But when aligned with price structure, it becomes a powerful confirmation layer. Breakouts with participation are structurally healthier than breakouts without it.
Volatility Filters and ATR Adjustment
 Fixed point filters ignore volatility differences. This is where volatility-based filters improve breakout validation.
Average True Range (ATR) measures typical range of price movement over a specified period and accounts for gaps and range expansion. Using ATR as a breakout filter means adjusting the required breakout distance based on current volatility conditions.
For example:
- In a high-volatility environment, the required breakout distance increases.
- In a low-volatility environment, a smaller move may suffice.
This dynamic adjustment reduces false signals in volatile assets and prevents over-filtering in stable ones. ATR-based filters expand and contract naturally with market conditions, making them more adaptive than fixed percent rules.
Many professionals use ATR multiples (for example, requiring a close beyond the level by 0.5× to 1× ATR) to confirm that movement is meaningful relative to normal noise.
Volatility-adjusted breakouts are statistically more robust than fixed-threshold methods. Structure must be evaluated in context - and volatility defines that context.
Pivot Points as Breakout Confirmation Tools
 Pivot points derive from a prior period’s high, low, and close and project potential support and resistance levels for the next session. Common calculations produce a central pivot (P) plus resistance levels (R1, R2) and support levels (S1, S2).
If price breaks a primary resistance level and also surpasses a pivot resistance, the breakout gains an additional layer of validation. Pivot levels are widely followed by intraday participants. Because many traders watch these levels, reactions can become self-reinforcing.
While pivot points do not guarantee predictive accuracy, they often function as useful confirmation layers. Breakouts that align with both horizontal resistance breaks and pivot level violations carry more structural significance than isolated penetrations.
Confirmation across independent frameworks strengthens probability. The goal is not to collect indicators - it is to validate that multiple groups are reacting to the same structural change.
Can Breakouts Be Anticipated? Early Clues and Compression
Although confirmation is safer, structural clues can suggest a breakout may be approaching. Common anticipatory signals include repeated testing of resistance, higher lows forming beneath resistance, rising volume during rallies, and declining volume during pullbacks.
When price consolidates just below resistance and each pullback becomes shallower, it implies increasing buying pressure. This compression pattern often precedes breakout because the market is repeatedly absorbing supply at roughly the same level.
However, anticipatory entries carry higher risk. Entering before confirmation exposes the trader to failure if resistance holds. The trade-off is clear:
Early entry → better price, lower probability
Confirmed breakout → higher probability, worse price
Professionals often size smaller when anticipating and add after confirmation. Anticipation is a strategic choice - not a shortcut.
Understanding Stop Orders: Entry Stops vs Exit Stops
A stop order activates once a specified price level is reached.
Entry stops are used to participate only if price confirms a breakout. For example, placing a buy stop slightly above resistance ensures exposure only if upside strength persists. Exit stops protect capital. If price moves against the position and reaches the stop level, the position is closed.
Two common exit stop types are protective stops (to cap loss) and trailing stops (to protect gains as price advances). Stops are defensive mechanisms that acknowledge uncertainty and enforce discipline.
Breakout trading without stop management is speculation. Stops define risk before entry. Risk must always be known in advance.
Whipsaws and the Danger of Tight Stops
A whipsaw occurs when price briefly moves against a position, triggers a stop, and then resumes the original trend. Whipsaws are common in volatile environments and near obvious levels where liquidity is concentrated.
Placing stops too close to entry increases whipsaw probability. Placing stops too far increases risk exposure. The key is structural placement: stops should sit beyond meaningful technical levels - not arbitrary distances.
For breakout trades, stops are often placed below the breakout level (for longs), below a recent swing low, or at a multiple of ATR.
Whipsaws cannot be eliminated entirely. They can be reduced through volatility-aware placement and disciplined position sizing. The goal is not perfection. The goal is controlled damage.
Changing Stop Orders: The Discipline Rule
One of the most important principles in professional trading is simple:
Never move a stop further away to avoid taking a loss.
Doing so transforms a risk-managed trade into emotional gambling. If analysis justified a stop at a certain level, moving it after entry negates the original logic.
Stops may be adjusted only in the direction of profit - not against it. When price moves favorably, trailing stops can protect gains. But widening stops during losses reflects denial rather than analysis.
Stop discipline enforces accountability. It ensures risk is predetermined and respected. Professional trading success depends less on perfect entries and more on consistent risk control.
Stops are not signs of weakness. They are structural insurance.
Protective Stops: Defining Risk Before the Trade Begins
Every professional trade begins with an exit plan.
A protective stop is established at the moment of entry, often before the order is even executed. Its purpose is capital preservation and predefined risk measurement. No system is correct 100% of the time. Long-term success is driven by risk control, not by eliminating losses.
A properly placed protective stop accomplishes three objectives:
- It defines the point where the original analysis is invalidated.
- It limits loss to a predetermined amount.
- It removes emotional decision-making once the trade is live.
A protective stop should be based on market structure - not on a comfort-based dollar value. Logical levels include below confirmed support, beneath a breakout retest, below a trend line with buffer, or at a volatility-adjusted threshold (such as an ATR multiple).
Stops based purely on arbitrary dollar loss often ignore price structure and lead to premature exits. Professional trading is about knowing the risk before capital is committed - not discovering it afterward.
Risk Sizing and Position Control: The Mathematics of Survival
Once a protective stop is defined, position size must be determined.
Risk per share (or contract) is the difference between entry price and stop level. Position size is adjusted so total risk remains within acceptable limits. This keeps risk consistent across trades, prevents one position from threatening overall capital, and reduces drawdown volatility.
Without predefined risk sizing, emotional behavior dominates. Many professional frameworks cap risk per trade to a small portion of capital, often around 1–2% for diversified portfolios. The specific number is less important than the principle: you must be able to survive clusters of losses.
The key insight is structural:
Entry determines opportunity.
Position sizing determines survival.
Without mathematical discipline, even strong technical analysis eventually fails.
Trailing Stops: Protecting Profits in Trending Markets
While protective stops prevent large losses, trailing stops protect gains.
As a position becomes profitable, the original stop level may become too distant from price. Leaving it unchanged exposes accumulated profits to unnecessary risk. A trailing stop advances in the direction of the trend but never retreats.
Trailing stops are valuable in strong trends because trends retrace in stages, pullbacks can deepen before continuation, and profits can evaporate quickly when momentum shifts. By moving the stop upward (for longs) or downward (for shorts), traders lock in profit without needing to predict the exact top or bottom.
Trailing stops are not about perfect exits. They are about staying in the move until the move proves itself over.
Trend Line Trailing Stops: Structural Progression Method
One of the simplest trailing stop techniques is to follow a well-defined trend line.
As price forms higher lows in an uptrend, a rising trend line develops beneath price. A trailing stop can be placed slightly below that line, often using a buffer similar to breakout confirmation rules.
This method ties exits directly to structure, reduces false signals when a buffer is used, and preserves profits during extended trends. However, steep trends and volatile assets may require volatility buffers to avoid premature stop-outs.
Trend line trailing stops are most effective when price action is orderly. They become less reliable in highly choppy environments. Structure-based trailing aligns exit logic with the same framework used for entry, maintaining consistency.
ATR Trailing Stops and the Chandelier Exit
Volatility-adjusted trailing stops improve adaptability.
A common method sets a stop a multiple of ATR below the highest high (for long positions). For example, with a 14-period ATR of $2.50 and a 3× multiple, the stop sits $7.50 below the recent high. As price makes new highs, the stop ratchets upward but never moves downward.
This approach is often called a Chandelier Exit because the stop “hangs” below price at a volatility-adjusted distance. It adapts automatically as volatility expands or contracts, reduces false exits in volatile trends, and provides objective calculation.
ATR-based trailing is especially useful in accelerating trends where clean structure may be less visible. It is volatility-driven rather than pattern-driven, which can be beneficial when the move becomes emotional or extended.
Parabolic SAR as a Trailing Stop Mechanism
Parabolic SAR (Stop and Reverse) is a trend-following exit method that becomes more aggressive as a trend continues. It uses an acceleration factor that increases with trend progress, causing the stop to rise or fall faster over time.
Its purpose is to capture extended moves while exiting quickly when momentum shifts. The trade-off is sensitivity: SAR can produce frequent whipsaws in volatile or sideways conditions. Some traders reduce noise by pairing SAR with volatility filters or by using it only after a trend is clearly established.
SAR’s strength is mechanical clarity. It removes discretion and enforces systematic exit behavior. It tends to work best in sustained directional trends and less effectively in range-bound environments.
Percentage-Based Trailing Stops: Profit-Leg Method
Another trailing technique uses a percentage of accumulated gains. A trader might allow a portion of the profit leg to retrace (for example, 30%–50%) before exiting, then adjust the stop higher as additional legs form.
This method assumes trends progress in measurable waves. By capturing part of each wave, the trader preserves profit without relying on specific structural levels.
The weakness is that percentage stops may ignore volatility and real support zones. In volatile trends, they may exit too early. In slow reversals, they may exit too late. Because they are not anchored to structure or volatility, percentage stops are simple but not always precise.
Time Stops: When Patience Has a Cost
Time is a hidden variable in trading.
A time stop exits a trade after a predefined period if price fails to move favorably. The rationale is opportunity cost: capital tied in stagnant trades cannot be deployed elsewhere. If a breakout does not produce follow-through within a reasonable timeframe, the probability of success often declines.
Time stops are especially useful in systematic strategies and backtests where holding duration must be standardized. They enforce efficiency and discourage “hope holding.” This method is not based on price invalidation; it is based on performance failure.
Markets reward decisiveness. When momentum does not appear, capital may be better allocated elsewhere.
Money Stops: Why Dollar-Based Stops Can Be Dangerous
A money stop defines risk solely in dollar terms, such as “I will risk $10,000 on this trade.”
While controlling monetary risk is essential, exiting purely because a dollar amount has been lost - regardless of structure - can be problematic. Money stops often ignore support and resistance, volatility, trend structure, and confirmation.
This can lead to whipsaws, exiting just before support holds, and emotional behavior disguised as discipline. Professional practice is to determine structural invalidation first, then size the position so the monetary risk aligns with acceptable limits.
Structure first. Capital second. Money-based exits alone rarely produce optimal technical results.
Using Stops With Breakouts: Structural Alignment
Stops and breakouts must work together.
When a breakout occurs, entry stops may trigger participation and protective stops define failure points. If price breaks above resistance and then falls back below the breakout level, the structural premise may be invalidated.
Common breakout stop placements include slightly below the breakout level, below the retest support zone, or at a volatility-adjusted buffer (such as a fraction or multiple of ATR). The most reliable breakouts often follow clear patterns and confirm with participation.
Without stops, breakouts become emotional chases. With stops, breakouts become structured probabilities.
Using Stops When Price Gaps Occur
Gaps occur when price opens outside the prior period’s trading range, often reflecting new information or a sudden imbalance between buyers and sellers.
When a breakout is accompanied by a gap, it may indicate strong conviction and accelerate momentum. However, if the gap quickly fills (price returns into the prior range), it suggests the breakout may have failed.
In gap scenarios, many traders anchor risk to the gap structure itself. A common approach is to place protective stops beyond the gap’s key reference level so the trade exits quickly if the market rejects the move.
Gaps require discipline. Chasing large gap openings without predefined stops exposes traders to rapid reversals. Gap continuation requires follow-through. Gap failure requires immediate risk control.
Placing Stops for a False Breakout: Specialist Traps
 Not all breakouts are genuine. Some moves are designed to trigger orders clustered above resistance or below support, producing a false breakout.
In a false upside breakout, price breaks above resistance, buy stops trigger, shorts cover, momentum appears to accelerate, follow-through fails, and price reverses back below resistance. This traps late buyers.
To reduce damage, disciplined traders place protective stops just back inside the breakout boundary. If price cannot sustain outside the level, the premise is invalidated quickly. This approach accepts small controlled losses rather than large emotional drawdowns.
False breakouts can also become opportunities. If price reverses aggressively after trapping breakout buyers, a counter-trade may emerge back inside the range. The key principle remains consistent: breakouts must prove themselves. Stops must assume traps are possible.
Retracements: The Counter-Move Within a Trend
Trends do not move in straight lines.
Every primary trend contains smaller counter-trend movements. These temporary pullbacks are known as retracements. In an uptrend, periodic corrections interrupt the advance and often pause at support. In a downtrend, temporary rallies interrupt the decline and often stall at resistance.
A retracement is not a reversal. It is a smaller trend moving against the dominant direction. Retracements relieve overextended conditions, shake out weak participants, and create new entry opportunities.
The depth and behavior of a retracement often reveals the health of the primary trend. Shallow retracements suggest strong momentum. Deep retracements can warn of structural weakness.
Retracements matter in breakout trading because many breakouts are retested before continuation. The counter-move often provides the second opportunity.
Measuring Retracements: 33%, 50%, 61.8% and Beyond
Traders frequently measure retracements as a percentage of the prior move. Common reference levels include 33%, 50%, and 66%, along with Fibonacci levels like 38.2% and 61.8%.
However, retracements rarely stop at perfect mathematical values. Markets are dynamic. Percentage levels are guidelines that provide context, not mechanical triggers.
A practical structural observation is often used:
- Less than ~50% retracement → trend likely intact
- More than ~50% retracement → trend potentially weakening
Even so, percentages should be cross-checked with real structure: prior support zones, trend lines, volume behavior, and volatility conditions. Strong trends typically correct less. Weak trends correct more. Measurement helps frame probability, not guarantee precision.
Pullbacks and Throwbacks: Post-Breakout Retests
 After a breakout, price often returns briefly to the breakout level.
A throwback occurs when price breaks upward, then pulls back to former resistance (now support). A pullback occurs when price breaks downward, then rallies to former support (now resistance). These retests evaluate whether the breakout level has truly changed role.
If the retest holds, the breakout strengthens and risk declines. If it fails, the breakout may have been false and structural weakness emerges.
Retests often provide lower-risk entries for traders who missed the initial move. Many professionals prefer entering on the retest rather than chasing the breakout bar. Patience improves risk-to-reward. Retests reduce emotional entries. Structure should be respected, not rushed.
Waiting for Retracement Before Entry
 Some traders do not enter immediately upon breakout. They wait for a retracement, pullback, or throwback, assuming many breakouts are retested before continuation.
A common process is: identify breakout, wait for price to return toward the breakout zone, enter near support with a limit-style approach, and place a protective stop beyond structural invalidation.
Advantages include better average entry price, improved risk-to-reward, and reduced chasing. The risk is missing the move if price never retests. To balance this, some traders scale: partial size on breakout, partial size on retest.
Retracement entries reward patience. Breakout entries reward decisiveness. Both require structure.
Calculating Risk/Return Ratio for Breakout Trades
Every breakout trade should be evaluated before execution.
Two numbers matter: risk (distance from entry to stop) and reward (distance from entry to objective). Breakout targets are often estimated using prior range height, measured-move projections, the next major support or resistance zone, or pattern objectives such as rectangles, triangles, and flags.
A common benchmark is aiming for at least a 3:1 reward-to-risk ratio. Even if only one out of three trades succeeds, profitability can still be achieved if losses stay controlled and winners are allowed to run.
If reward-to-risk falls below about 2:1, the statistical edge tends to shrink rapidly. Discipline requires asking: is the objective realistic, is the stop logical, and does the reward justify the risk?
If the math does not support the trade, the correct decision is to pass.
Conclusion: Discipline Over Prediction
Breakouts signal change. Stops enforce discipline. Retracements provide opportunity.
No confirmation method is perfect. No stop placement eliminates whipsaws entirely. No retracement percentage guarantees entry precision. What matters is consistency.
Stops should be placed at logical structural levels, account for volatility, never be canceled to avoid loss, and never be widened against the trade. Once a position is entered, risk must be defined and respected.
Technical analysis is not prediction. It is probability management.
Breakouts identify opportunity.
Stops protect capital.
Retracements test conviction.
Disciplined execution determines survival.
A Close Beyond the Level Is the Standard
Intraday breaks that reverse before the close are the most common false breakout trap. Requiring a full candle close beyond the resistance or support level -- confirmed by volume and at least one follow-through session -- filters out the majority of head fakes without missing the real moves. Price needs to prove it can hold the break, not just touch it.
Stop Placement Is Not Optional
Every breakout trade requires a defined level where the thesis is wrong. That level is almost always just beyond the structure that was broken -- if price reclaims it, the breakout was false and staying in compounds the error. Widening a stop to avoid a loss is one of the most destructive habits in trading because it converts small planned losses into large unplanned ones.
Retests Often Create Better Entries Than Chasing
A significant portion of genuine breakouts pull back to retest the broken level as new support or resistance before continuing. Waiting for that retest -- rather than chasing the initial spike -- produces tighter stops, better reward-to-risk, and confirmation that the level is holding. Missing the first move is not a loss if the retest entry is cleaner.
Quick FAQ
What is the most reliable breakout confirmation method?
There is no single best method. Strong confirmations combine a close beyond the level, sustained holding time, and participation or volatility context to reduce false breaks.
Where should a stop go on a breakout trade?
The most common placement is beyond structural invalidation: slightly back inside the broken level, below the retest support zone, below the last swing low, or at an ATR-based buffer.
Why do breakouts fail so often near obvious levels?
Obvious levels attract clustered orders. Price may probe beyond the level to trigger stops and harvest liquidity before reversing back into the range.
Should I enter on the breakout or the retest?
Breakout entries capture momentum but risk more false moves. Retest entries improve price and reward-to-risk but risk missing the move. Many traders scale across both.
How can I reduce whipsaws without using huge stops?
Use volatility-aware placement (ATR buffers), avoid overly tight stops near crowded levels, and reduce size when volatility is elevated so stops can be structurally logical.
DailyIQ publishes market education, score methodology, and research workflows to help users understand what the platform is measuring. Content is for informational purposes only and is not investment advice or a recommendation to buy or sell any security.
Use education with process, not in isolation
See how DailyIQ combines technical indicators, news sentiment, freshness checks, and editorial review to decide what gets surfaced and indexed.
Learn About Investing
These resources can help investors evaluate momentum, volatility, and trend strength when analyzing Breakouts, Stops & Retracements: The Institutional Trading Framework.
 Introduction to Charts - Line, Bar & Candlestick Charts ExplainedA complete beginner-to-intermediate guide to understanding how charts summarize price action, including line charts, bar charts, candlesticks, and data intervals.Technical · 22 min read
 Trend Lines in Technical Analysis: The Complete Institutional GuideMaster trend lines, accelerating and decelerating structures, channels, log scale, Pitchfork, Gann fans, and professional breakout confirmation.Technical · 22 min read
 What Is ATR and How to Use ItLearn how the Average True Range (ATR) measures volatility and helps you set smarter stop losses and position sizes.Volatility · 16 min read
 What Are Bollinger Bands and How to Read ThemLearn how Bollinger Bands measure volatility, identify breakouts, and highlight overextended price conditions.Volatility · 16 min read
 Advanced Chart Analysis: Scaling, Volume, and Comparative Charting ExplainedA comprehensive guide to advanced chart construction including arithmetic vs logarithmic scales, dual y-axes, multi-line comparisons, and volume-based charting techniques.Technical · 22 min read